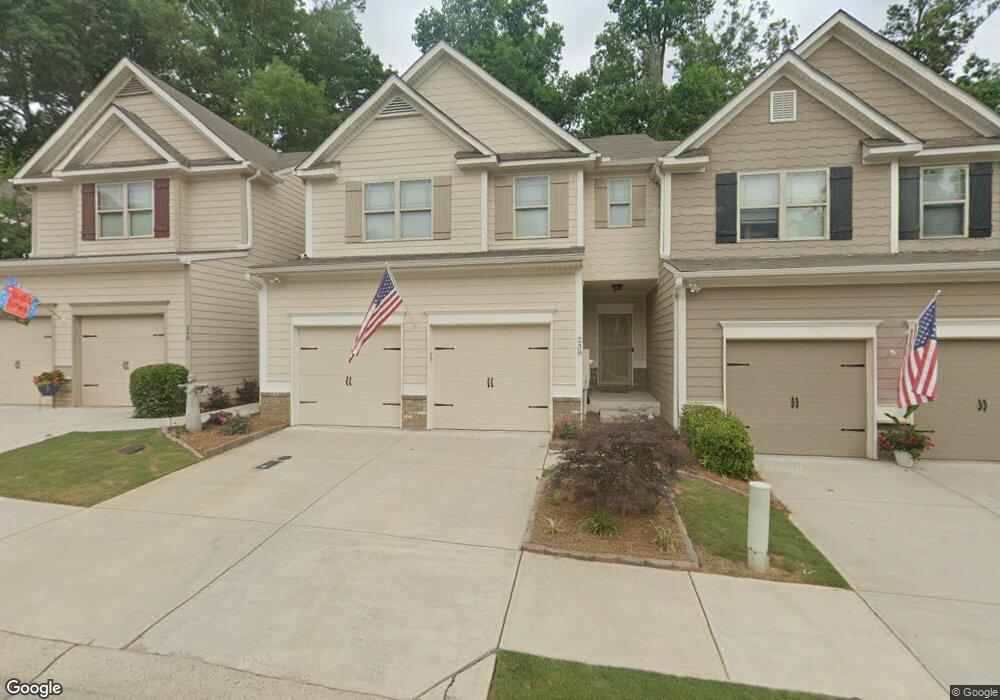
238 Oakview Dr Unit 54 Canton, GA 30114
Estimated Value: $368,000 - $368,923
3
Beds
3
Baths
2,180
Sq Ft
$169/Sq Ft
Est. Value
About This Home
This home is located at 238 Oakview Dr Unit 54, Canton, GA 30114 and is currently estimated at $368,462, approximately $169 per square foot. 238 Oakview Dr Unit 54 is a home located in Cherokee County with nearby schools including J. Knox Elementary School, Teasley Middle School, and Cherokee High School.
Ownership History
Date
Name
Owned For
Owner Type
Purchase Details
Closed on
Jan 22, 2019
Sold by
Foutch Michael
Bought by
Infante Anthony D
Current Estimated Value
Purchase Details
Closed on
Mar 17, 2017
Sold by
Kerley Family Homes Llc
Bought by
Michael Foutch and Riley Angela
Home Financials for this Owner
Home Financials are based on the most recent Mortgage that was taken out on this home.
Original Mortgage
$171,888
Interest Rate
4.15%
Mortgage Type
New Conventional
Purchase Details
Closed on
Apr 1, 2016
Sold by
Little House Builders Llc
Bought by
Kerley Family Homes Llc and Kerley Family Home At Hr Llc
Purchase Details
Closed on
Mar 20, 2013
Sold by
Msh Syndicated Holdings Ll
Bought by
Little House Builders Llc
Purchase Details
Closed on
Mar 27, 2012
Sold by
Mcbride Son Homes Land D
Bought by
Msh Syndicated Holdings Llc and C/O Bank Of America Na
Create a Home Valuation Report for This Property
The Home Valuation Report is an in-depth analysis detailing your home's value as well as a comparison with similar homes in the area
Home Values in the Area
Average Home Value in this Area
Purchase History
| Date | Buyer | Sale Price | Title Company |
|---|---|---|---|
| Infante Anthony D | $240,000 | -- | |
| Michael Foutch | $214,860 | -- | |
| Kerley Family Homes Llc | $259,500 | -- | |
| Little House Builders Llc | $291,500 | -- | |
| Msh Syndicated Holdings Llc | -- | -- |
Source: Public Records
Mortgage History
| Date | Status | Borrower | Loan Amount |
|---|---|---|---|
| Previous Owner | Michael Foutch | $171,888 |
Source: Public Records
Tax History Compared to Growth
Tax History
| Year | Tax Paid | Tax Assessment Tax Assessment Total Assessment is a certain percentage of the fair market value that is determined by local assessors to be the total taxable value of land and additions on the property. | Land | Improvement |
|---|---|---|---|---|
| 2024 | $4,052 | $153,228 | $26,000 | $127,228 |
| 2023 | $3,474 | $149,204 | $26,000 | $123,204 |
| 2022 | $3,330 | $122,376 | $18,000 | $104,376 |
| 2021 | $2,865 | $96,000 | $17,721 | $78,279 |
| 2020 | $2,977 | $97,520 | $18,000 | $79,520 |
| 2019 | $2,842 | $93,040 | $16,400 | $76,640 |
| 2018 | $2,578 | $83,920 | $13,200 | $70,720 |
| 2017 | $152 | $110,900 | $13,200 | $31,160 |
| 2016 | $152 | $14,800 | $5,920 | $0 |
| 2015 | $168 | $13,200 | $5,280 | $0 |
| 2014 | $77 | $6,000 | $2,400 | $0 |
Source: Public Records
Map
Nearby Homes
- 233 Oakview Dr
- 210 Oakview Dr
- The Deerfield Plan at River Green - The Village
- The Greenfield Plan at River Green - The Village
- 221 Village Overlook Unit H2
- 100 Academy Ln
- 318 Rampart St
- 316 Rampart St
- 314 Rampart St
- 312 Rampart St
- 315 N Rampart St
- 117 Market Ln
- 203 Retreat Ln
- 201 Retreat Ln
- 233 Retreat Ln
- 324 Willow Walk
- 421 Retreat Ln
- 425 Retreat Ln Unit K1
- 425 Retreat Ln
- 427 Retreat Ln
- 238 Oakview Dr Unit 56
- 238 Oakview Dr
- 236 Oakview Dr Unit 55
- 236 Oakview Dr Unit 54
- 236 Oakview Dr
- 240 Oakview Dr Unit 57
- 240 Oakview Dr Unit 54
- 240 Oakview Dr
- 234 Oakview Dr Unit 54
- 234 Oakview Dr
- 232 Oakview Dr Unit 53
- 232 Oakview Dr
- 313 Oakview Way
- 242 Oakview Dr Unit 58
- 242 Oakview Dr
- 230 Oakview Dr Unit 52
- 230 Oakview Dr
- 315 Oakview Way
- 311 Oakview Way
- 311 Oakview Way Unit 1