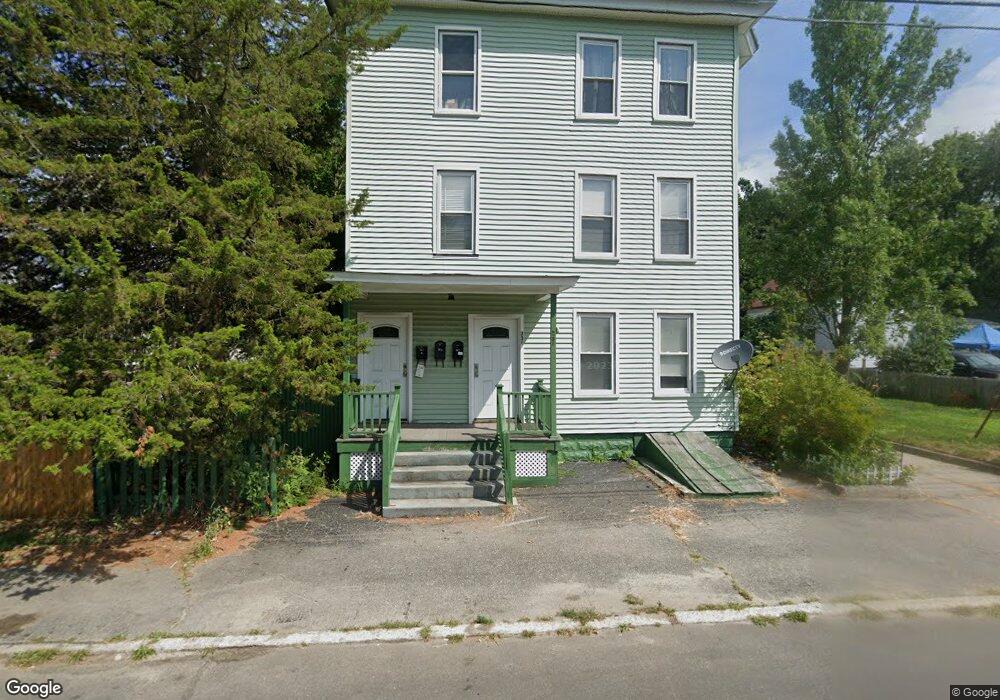
238 Silver St Manchester, NH 03103
Kalivas-Union NeighborhoodEstimated Value: $715,000 - $729,000
9
Beds
3
Baths
4,110
Sq Ft
$176/Sq Ft
Est. Value
About This Home
This home is located at 238 Silver St, Manchester, NH 03103 and is currently estimated at $723,333, approximately $175 per square foot. 238 Silver St is a home located in Hillsborough County with nearby schools including Beech Street School, Henry J. McLaughlin Middle School, and Cardinal Lacroix Academy.
Ownership History
Date
Name
Owned For
Owner Type
Purchase Details
Closed on
Feb 24, 2006
Sold by
Chen Feng
Bought by
Pinard David A
Current Estimated Value
Home Financials for this Owner
Home Financials are based on the most recent Mortgage that was taken out on this home.
Original Mortgage
$287,200
Outstanding Balance
$162,314
Interest Rate
6.17%
Mortgage Type
Purchase Money Mortgage
Estimated Equity
$561,019
Create a Home Valuation Report for This Property
The Home Valuation Report is an in-depth analysis detailing your home's value as well as a comparison with similar homes in the area
Home Values in the Area
Average Home Value in this Area
Purchase History
| Date | Buyer | Sale Price | Title Company |
|---|---|---|---|
| Pinard David A | $359,000 | -- | |
| Pinard David A | $359,000 | -- |
Source: Public Records
Mortgage History
| Date | Status | Borrower | Loan Amount |
|---|---|---|---|
| Open | Pinard David A | $287,200 | |
| Closed | Pinard David A | $287,200 |
Source: Public Records
Tax History Compared to Growth
Tax History
| Year | Tax Paid | Tax Assessment Tax Assessment Total Assessment is a certain percentage of the fair market value that is determined by local assessors to be the total taxable value of land and additions on the property. | Land | Improvement |
|---|---|---|---|---|
| 2024 | $8,325 | $425,200 | $77,300 | $347,900 |
| 2023 | $8,019 | $425,200 | $77,300 | $347,900 |
| 2022 | $7,756 | $425,200 | $77,300 | $347,900 |
| 2021 | $7,518 | $425,200 | $77,300 | $347,900 |
| 2020 | $6,569 | $266,400 | $55,400 | $211,000 |
| 2019 | $6,479 | $266,400 | $55,400 | $211,000 |
| 2018 | $6,308 | $266,400 | $55,400 | $211,000 |
| 2017 | $6,212 | $266,400 | $55,400 | $211,000 |
| 2016 | $6,164 | $266,400 | $55,400 | $211,000 |
| 2015 | $6,087 | $259,700 | $57,400 | $202,300 |
| 2014 | $6,103 | $259,700 | $57,400 | $202,300 |
Source: Public Records
Map
Nearby Homes