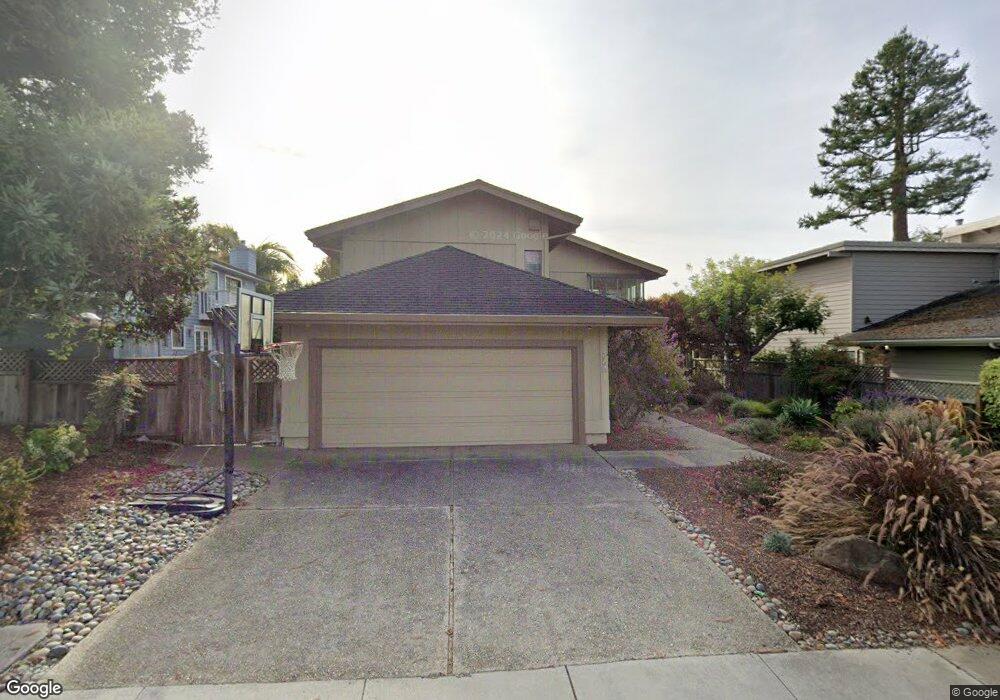
238 Via Lantana Aptos, CA 95003
Rio del Mar NeighborhoodEstimated Value: $1,516,000 - $1,965,000
2
Beds
3
Baths
2,188
Sq Ft
$804/Sq Ft
Est. Value
About This Home
This home is located at 238 Via Lantana, Aptos, CA 95003 and is currently estimated at $1,758,930, approximately $803 per square foot. 238 Via Lantana is a home located in Santa Cruz County with nearby schools including Rio Del Mar Elementary School, Aptos Junior High School, and Aptos High School.
Ownership History
Date
Name
Owned For
Owner Type
Purchase Details
Closed on
Jun 7, 2007
Sold by
Hardy Keith D and Hardy Pamela
Bought by
Hardy Keith D and Hardy Pamela Frost
Current Estimated Value
Purchase Details
Closed on
Jul 29, 1999
Sold by
Minou
Bought by
Hardy Keith D and Hardy Pamela
Home Financials for this Owner
Home Financials are based on the most recent Mortgage that was taken out on this home.
Original Mortgage
$240,000
Outstanding Balance
$64,775
Interest Rate
6.87%
Estimated Equity
$1,694,155
Purchase Details
Closed on
May 29, 1998
Sold by
Shamshoian Peter C and Shamshoian Sandra L
Bought by
Rahimizad Nader R and Rahimizad Minou
Home Financials for this Owner
Home Financials are based on the most recent Mortgage that was taken out on this home.
Original Mortgage
$380,000
Interest Rate
4.95%
Create a Home Valuation Report for This Property
The Home Valuation Report is an in-depth analysis detailing your home's value as well as a comparison with similar homes in the area
Home Values in the Area
Average Home Value in this Area
Purchase History
We collect this data history from publicly available records. To have your information removed, we recommend requesting removal directly through your county’s website.
| Date | Buyer | Sale Price | Title Company |
|---|---|---|---|
| Hardy Keith D | -- | None Available | |
| Hardy Keith D | $460,000 | Santa Cruz Title Company | |
| Rahimizad Nader R | $425,000 | Old Republic Title Company |
Source: Public Records
Mortgage History
We collect this data history from publicly available records. To have your information removed, we recommend requesting removal directly through your county’s website.
| Date | Status | Borrower | Loan Amount |
|---|---|---|---|
| Open | Hardy Keith D | $240,000 | |
| Previous Owner | Rahimizad Nader R | $380,000 |
Source: Public Records
Tax History
| Year | Tax Paid | Tax Assessment Tax Assessment Total Assessment is a certain percentage of the fair market value that is determined by local assessors to be the total taxable value of land and additions on the property. | Land | Improvement |
|---|---|---|---|---|
| 2025 | $8,867 | $707,018 | $424,208 | $282,810 |
| 2023 | $8,668 | $679,564 | $407,736 | $271,828 |
| 2022 | $8,470 | $666,239 | $399,741 | $266,498 |
| 2021 | $8,187 | $653,176 | $391,903 | $261,273 |
| 2020 | $8,047 | $646,478 | $387,884 | $258,594 |
| 2019 | $7,903 | $633,802 | $380,279 | $253,523 |
| 2018 | $7,687 | $621,374 | $372,822 | $248,552 |
| 2017 | $7,612 | $609,192 | $365,513 | $243,679 |
| 2016 | $7,426 | $597,247 | $358,346 | $238,901 |
| 2015 | $7,344 | $588,275 | $352,963 | $235,312 |
| 2014 | $7,170 | $576,752 | $346,049 | $230,703 |
Source: Public Records
Map
Nearby Homes
- 2013 Dolphin Dr
- 2011 Dolphin Dr
- 142 Bar Harbor Ct
- 1931 Dolphin Dr
- 1572 Seascape Blvd
- 145 Farallon Ct Unit 2
- 221 Seascape Resort Dr
- 117 Seascape Resort Dr
- 312 Seascape Resort Dr
- 111 Seascape Resort Dr
- 211 Seascape Resort Dr
- 302 Seascape Resort Dr
- 100 Seascape Resort Dr
- 1514 Dolphin Dr
- 308 Ventana Way
- 315 Camino al Barranco
- 7 Seascape Resort Dr
- 60 Seascape Resort Dr
- 22 Seascape Resort Dr
- 162 Mar Monte Ave
- 2235 Dolphin Dr
- 230 Via Lantana
- 222 Via Lantana
- 245 Via Lantana
- 221 Via Trinita
- 237 Via Lantana
- 213 Via Trinita
- 214 Via Lantana
- 229 Via Trinita
- 229 Via Lantana
- 304 Bowsprit Dr
- 205 Via Trinita
- 2277 Dolphin Dr
- 2240 Dolphin Dr
- 206 Via Lantana
- 2252 Dolphin Dr
- 197 Via Trinita
- 2192 Dolphin Dr
- 2270 Dolphin Dr
- 213 Via Lantana
Your Personal Tour Guide
Ask me questions while you tour the home.