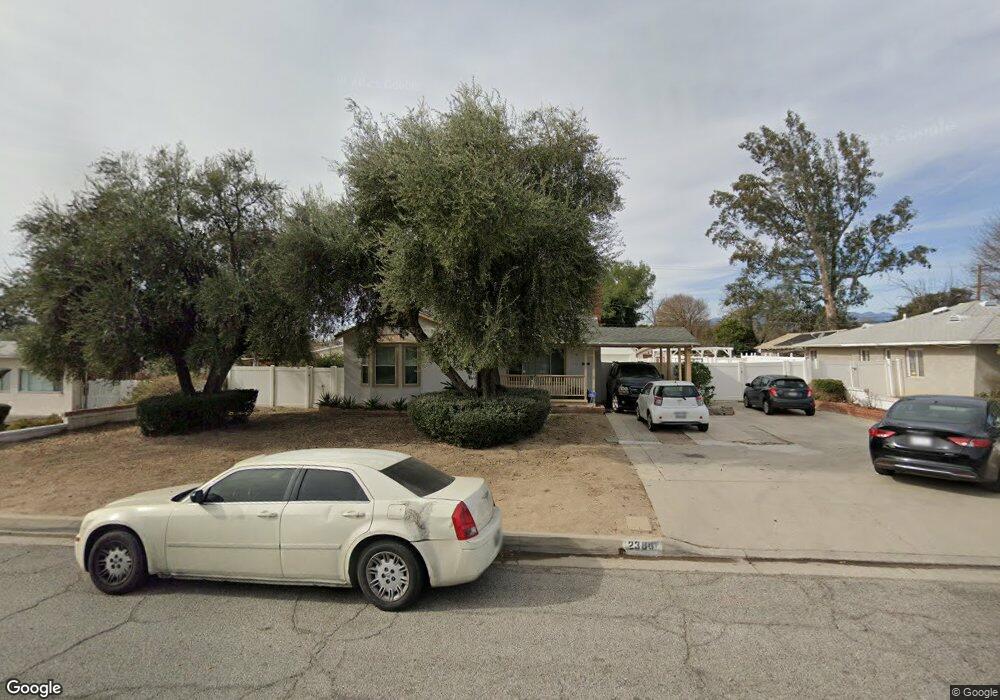
2380 Harrison St San Bernardino, CA 92404
Northeast Sterling NeighborhoodEstimated Value: $473,000 - $532,000
3
Beds
3
Baths
1,700
Sq Ft
$292/Sq Ft
Est. Value
About This Home
This home is located at 2380 Harrison St, San Bernardino, CA 92404 and is currently estimated at $496,509, approximately $292 per square foot. 2380 Harrison St is a home located in San Bernardino County with nearby schools including Jefferson Hunt Elementary School, Del Vallejo Middle School, and Pacific High School.
Ownership History
Date
Name
Owned For
Owner Type
Purchase Details
Closed on
Apr 11, 2002
Sold by
Brothers Estate Specialists Inc
Bought by
Lunden La Ray
Current Estimated Value
Home Financials for this Owner
Home Financials are based on the most recent Mortgage that was taken out on this home.
Original Mortgage
$122,100
Outstanding Balance
$51,086
Interest Rate
6.94%
Mortgage Type
Purchase Money Mortgage
Estimated Equity
$445,423
Purchase Details
Closed on
Jul 31, 2000
Sold by
Kaufmann Michelle L
Bought by
Brothers Estate Specialists Inc
Purchase Details
Closed on
Jul 25, 1995
Sold by
Va
Bought by
Kaufmann Michelle L
Home Financials for this Owner
Home Financials are based on the most recent Mortgage that was taken out on this home.
Original Mortgage
$77,000
Interest Rate
7.62%
Mortgage Type
Seller Take Back
Purchase Details
Closed on
Apr 12, 1995
Sold by
Countrywide Funding Corp
Bought by
Va
Purchase Details
Closed on
Mar 21, 1995
Sold by
Castro Faustino A and Castro Colleen
Bought by
Countrywide Funding Corp
Create a Home Valuation Report for This Property
The Home Valuation Report is an in-depth analysis detailing your home's value as well as a comparison with similar homes in the area
Home Values in the Area
Average Home Value in this Area
Purchase History
| Date | Buyer | Sale Price | Title Company |
|---|---|---|---|
| Lunden La Ray | $126,000 | American Title | |
| Brothers Estate Specialists Inc | -- | -- | |
| Kaufmann Michelle L | $77,000 | Gateway Title | |
| Va | -- | Fidelity National Title Ins | |
| Countrywide Funding Corp | $98,590 | Fidelity National Title Ins |
Source: Public Records
Mortgage History
| Date | Status | Borrower | Loan Amount |
|---|---|---|---|
| Open | Lunden La Ray | $122,100 | |
| Previous Owner | Kaufmann Michelle L | $77,000 |
Source: Public Records
Tax History Compared to Growth
Tax History
| Year | Tax Paid | Tax Assessment Tax Assessment Total Assessment is a certain percentage of the fair market value that is determined by local assessors to be the total taxable value of land and additions on the property. | Land | Improvement |
|---|---|---|---|---|
| 2025 | $2,358 | $185,993 | $46,498 | $139,495 |
| 2024 | $2,358 | $182,346 | $45,586 | $136,760 |
| 2023 | $2,297 | $178,770 | $44,692 | $134,078 |
| 2022 | $2,297 | $175,265 | $43,816 | $131,449 |
| 2021 | $2,298 | $171,829 | $42,957 | $128,872 |
| 2020 | $2,301 | $170,068 | $42,517 | $127,551 |
| 2019 | $2,233 | $166,733 | $41,683 | $125,050 |
| 2018 | $2,206 | $163,464 | $40,866 | $122,598 |
| 2017 | $2,137 | $160,259 | $40,065 | $120,194 |
| 2016 | $2,071 | $157,116 | $39,279 | $117,837 |
| 2015 | $1,957 | $154,756 | $38,689 | $116,067 |
| 2014 | $1,901 | $151,724 | $37,931 | $113,793 |
Source: Public Records
Map
Nearby Homes
- 2443 Roxbury Dr
- 2386 Roxbury Dr
- 1111 E 27th St
- 1264 E 26th St
- 719 E 23rd St
- 2761 N Golden Ave
- 1123 E 29th St
- 2517 Fremontia Dr
- 646 26th St
- 683 E 20th St
- 2744 Valencia Ave
- 1241 Holly Vista Blvd
- 2983 N Alameda Ave
- 2965 Garden Dr
- 3025 N Alameda Ave
- 1667 Valencia Ave
- 25144 19th St
- 1721 N Fairfax Dr
- 6937 Barton St
- 693 E Trenton St
- 2360 Harrison St
- 2410 Harrison St
- 2354 Harrison St
- 2422 Harrison St
- 2327 Lawrence Ave
- 2375 Lawrence Ave
- 2381 Harrison St
- 2222 Harrison St
- 2361 Harrison St
- 2391 Harrison St
- 2385 Lawrence Ave
- 2424 Harrison St
- 2325 Lawrence Ave
- 2437 Harrison St
- 2423 Harrison St
- 2460 Harrison St
- 2419 Lawrence Ave
- 2221 Harrison St
- 2205 Lawrence Ave
- 2302 N Newport Ave