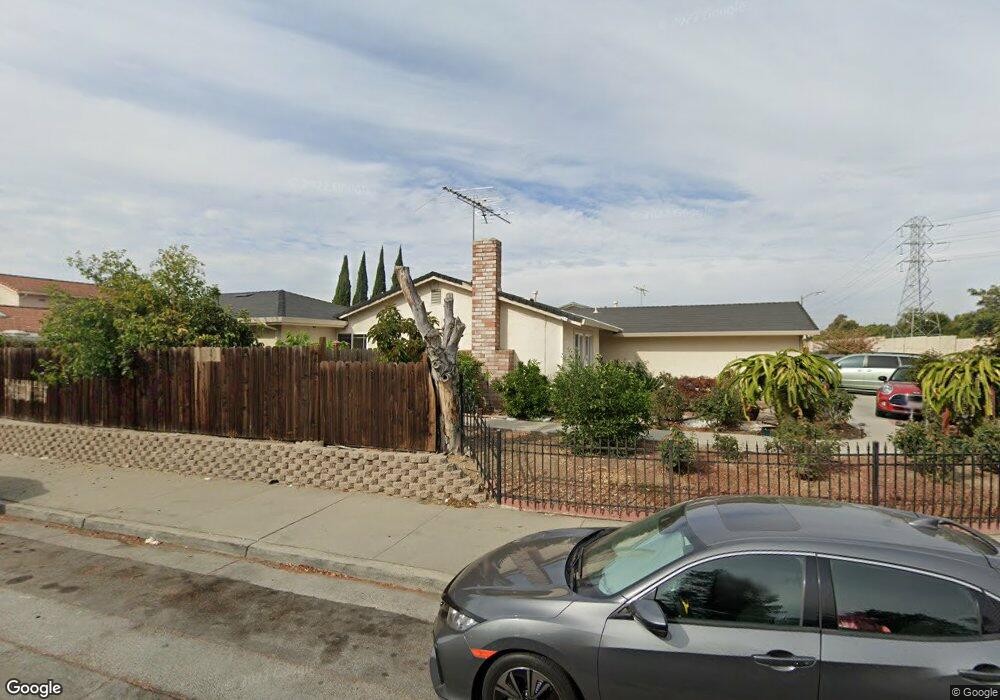
2380 Lanning Way San Jose, CA 95133
Commodore NeighborhoodEstimated Value: $1,089,000 - $1,323,332
5
Beds
3
Baths
885
Sq Ft
$1,365/Sq Ft
Est. Value
About This Home
This home is located at 2380 Lanning Way, San Jose, CA 95133 and is currently estimated at $1,208,083, approximately $1,365 per square foot. 2380 Lanning Way is a home located in Santa Clara County with nearby schools including Ben Painter Elementary School, William Sheppard Middle School, and Independence High School.
Ownership History
Date
Name
Owned For
Owner Type
Purchase Details
Closed on
May 12, 2012
Sold by
Vannguyen Ben
Bought by
Vannguyen Ben and Nguyen Teresa
Current Estimated Value
Home Financials for this Owner
Home Financials are based on the most recent Mortgage that was taken out on this home.
Original Mortgage
$227,000
Outstanding Balance
$157,866
Interest Rate
3.98%
Mortgage Type
New Conventional
Estimated Equity
$1,050,217
Purchase Details
Closed on
Oct 28, 2003
Sold by
Do Duke V and Do Donna N
Bought by
Vannguyen Ben
Home Financials for this Owner
Home Financials are based on the most recent Mortgage that was taken out on this home.
Original Mortgage
$259,840
Interest Rate
5.98%
Mortgage Type
Purchase Money Mortgage
Purchase Details
Closed on
Sep 27, 2001
Sold by
Parrish Bobby and Parrish Kelly P
Bought by
Do Duke and Do Donna N
Home Financials for this Owner
Home Financials are based on the most recent Mortgage that was taken out on this home.
Original Mortgage
$205,000
Interest Rate
6.9%
Create a Home Valuation Report for This Property
The Home Valuation Report is an in-depth analysis detailing your home's value as well as a comparison with similar homes in the area
Home Values in the Area
Average Home Value in this Area
Purchase History
| Date | Buyer | Sale Price | Title Company |
|---|---|---|---|
| Vannguyen Ben | $113,500 | Fidelity National Title Co | |
| Vannguyen Ben | $325,000 | First American Title Co | |
| Do Duke | $315,000 | Fidelity National Title Co |
Source: Public Records
Mortgage History
| Date | Status | Borrower | Loan Amount |
|---|---|---|---|
| Open | Vannguyen Ben | $227,000 | |
| Closed | Vannguyen Ben | $259,840 | |
| Previous Owner | Do Duke | $205,000 |
Source: Public Records
Tax History Compared to Growth
Tax History
| Year | Tax Paid | Tax Assessment Tax Assessment Total Assessment is a certain percentage of the fair market value that is determined by local assessors to be the total taxable value of land and additions on the property. | Land | Improvement |
|---|---|---|---|---|
| 2025 | $9,344 | $611,000 | $398,092 | $212,908 |
| 2024 | $9,344 | $599,021 | $390,287 | $208,734 |
| 2023 | $9,157 | $587,277 | $382,635 | $204,642 |
| 2022 | $8,981 | $575,763 | $375,133 | $200,630 |
| 2021 | $8,672 | $564,475 | $367,778 | $196,697 |
| 2020 | $8,503 | $558,688 | $364,007 | $194,681 |
| 2019 | $8,270 | $547,734 | $356,870 | $190,864 |
| 2018 | $8,162 | $536,995 | $349,873 | $187,122 |
| 2017 | $8,191 | $526,466 | $343,013 | $183,453 |
| 2016 | $7,728 | $516,144 | $336,288 | $179,856 |
| 2015 | $7,725 | $508,392 | $331,237 | $177,155 |
| 2014 | $7,197 | $498,434 | $324,749 | $173,685 |
Source: Public Records
Map
Nearby Homes
- 370 Englert Ct
- 2420 Kita Ln
- 2432 Kita Ln
- 559 Apricot Way
- 571 Apricot Way
- 2580 Gimelli Way
- 230 Montclair Ave
- 750 Fruit Ranch Loop
- 259 N Capitol Ave Unit 171
- 259 N Capitol Ave Unit 131
- 259 N Capitol Ave Unit 116
- 2599 Easton Ln Unit 108
- 2599 Easton Ln Unit 109
- 210 Gramercy Place
- 633 Easton Dr
- 2623 Gimelli Place Unit 139
- 210 Damsen Dr Unit 22
- 181 Alexander Ave
- 127 Schott St
- 709 Whitewater Ct Unit 44
- 2378 Lanning Way
- 440 Clogston Ct
- 2376 Lanning Way
- 442 Clogston Ct
- 424 Tortola Way
- 444 Clogston Ct
- 422 Tortola Way
- 388 Caribe Way
- 420 Tortola Way
- 2374 Lanning Way
- 390 Caribe Way
- 392 Caribe Way
- 394 Caribe Way
- 418 Tortola Way
- 398 Caribe Way
- 396 Caribe Way
- 446 Clogston Ct
- 386 Caribe Way
- 412 Tortola Way
- 410 Tortola Way