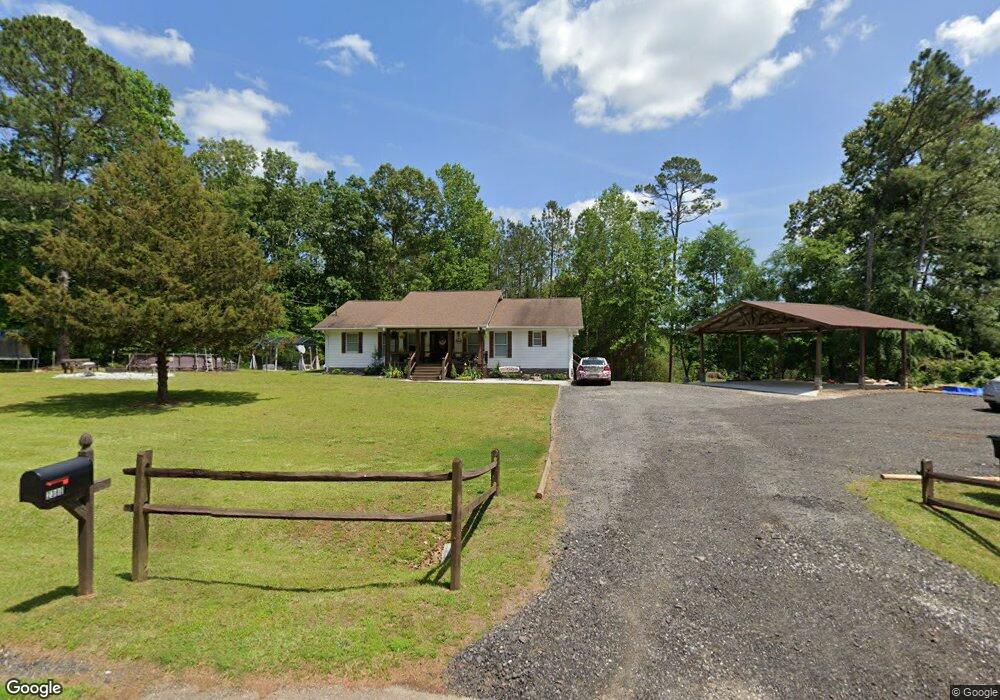
2380 McFarlin Bridge Rd Carnesville, GA 30521
Estimated Value: $263,000 - $421,000
3
Beds
2
Baths
1,785
Sq Ft
$193/Sq Ft
Est. Value
About This Home
This home is located at 2380 McFarlin Bridge Rd, Carnesville, GA 30521 and is currently estimated at $343,764, approximately $192 per square foot. 2380 McFarlin Bridge Rd is a home with nearby schools including Franklin County High School.
Ownership History
Date
Name
Owned For
Owner Type
Purchase Details
Closed on
Aug 16, 2024
Sold by
Murley Gina Renee
Bought by
Murley Christopher and Murley Gina Renee
Current Estimated Value
Home Financials for this Owner
Home Financials are based on the most recent Mortgage that was taken out on this home.
Original Mortgage
$233,618
Outstanding Balance
$230,708
Interest Rate
6.77%
Mortgage Type
New Conventional
Estimated Equity
$113,056
Purchase Details
Closed on
Aug 3, 2022
Sold by
Ayers Gina R
Bought by
Murley Gina Renee
Home Financials for this Owner
Home Financials are based on the most recent Mortgage that was taken out on this home.
Original Mortgage
$45,000
Interest Rate
5.3%
Mortgage Type
New Conventional
Purchase Details
Closed on
Apr 27, 2016
Sold by
Price Jennifer Fay
Bought by
Ayers Gina R
Purchase Details
Closed on
May 8, 2002
Sold by
Price Jennifer Fay and Price Mark E
Bought by
Price Jennifer Fay
Purchase Details
Closed on
Nov 23, 1994
Bought by
Price Jennifer Fay
Create a Home Valuation Report for This Property
The Home Valuation Report is an in-depth analysis detailing your home's value as well as a comparison with similar homes in the area
Home Values in the Area
Average Home Value in this Area
Purchase History
| Date | Buyer | Sale Price | Title Company |
|---|---|---|---|
| Murley Christopher | -- | -- | |
| Murley Gina Renee | -- | -- | |
| Ayers Gina R | $125,000 | -- | |
| Price Jennifer Fay | $30,000 | -- | |
| Price Jennifer Fay | -- | -- |
Source: Public Records
Mortgage History
| Date | Status | Borrower | Loan Amount |
|---|---|---|---|
| Open | Murley Christopher | $233,618 | |
| Previous Owner | Murley Gina Renee | $45,000 |
Source: Public Records
Tax History Compared to Growth
Tax History
| Year | Tax Paid | Tax Assessment Tax Assessment Total Assessment is a certain percentage of the fair market value that is determined by local assessors to be the total taxable value of land and additions on the property. | Land | Improvement |
|---|---|---|---|---|
| 2024 | $1,937 | $81,396 | $5,162 | $76,234 |
| 2023 | $1,909 | $73,997 | $4,693 | $69,304 |
| 2022 | $1,719 | $66,639 | $3,656 | $62,983 |
| 2021 | $1,591 | $57,822 | $3,656 | $54,166 |
| 2020 | $1,525 | $54,854 | $3,656 | $51,198 |
| 2019 | $1,474 | $54,854 | $3,656 | $51,198 |
| 2018 | $1,280 | $47,643 | $3,795 | $43,848 |
| 2017 | $1,331 | $47,643 | $3,795 | $43,848 |
| 2016 | $1,225 | $43,995 | $3,795 | $40,200 |
| 2015 | -- | $43,995 | $3,795 | $40,200 |
| 2014 | -- | $52,455 | $3,795 | $48,660 |
| 2013 | -- | $53,752 | $3,795 | $49,957 |
Source: Public Records
Map
Nearby Homes
- 83 Henry Williams Rd
- 6060 Highway 320
- LOT 10 Bent Tree Rd
- 2845 Hunters Creek Rd
- 125 Lewis Crump Rd
- 2630 Prospect Rd
- 0 Banks Academy Rd Unit 10636762
- 2526 Prospect Rd
- 1035 McFarlin Bridge Rd
- 340 Mcfarlin Blvd
- 701 Sunshine Rd
- 0 Red Hill Rd Unit 10564928
- 0 Poplar Mountain Ln
- 6343 Georgia 198
- 380 Stephens Rd
- 4001 Highway 198
- 964 Gooseneck Rd
- 4638 Highway 63
- 964 Gooseneck Rd
- 150 Garrison Rd
- 2414 McFarlin Bridge Rd
- 2441 McFarlin Bridge Rd
- 2535 McFarlin Bridge Rd
- 2533 McFarlin Bridge Rd
- 2176 McFarlin Bridge Rd
- 2094 McFarlin Bridge Rd
- 2625 McFarlin Bridge Rd
- 6685 Highway 320
- 6675 Highway 320
- 2050 McFarlin Bridge Rd
- 6680 Highway 320
- 6526 Highway 320
- 1992 McFarlin Bridge Rd
- 2121 Tract 4 McFarlin Bridge Unit 4
- 6421 Highway 320
- 6436 Highway 320
- 6436 Highway 320
- 2955 McFarlin Bridge Rd
- 167 Henry Williams Rd
- 0 Georgia 320 Unit 3241646