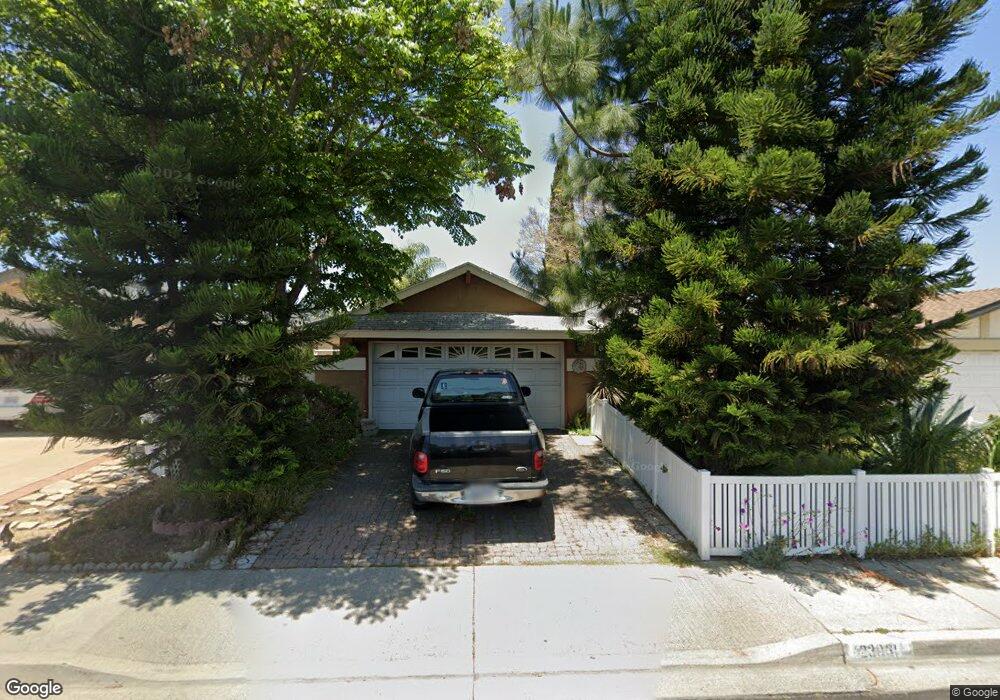
23831 Boeing Ln Lake Forest, CA 92630
Estimated Value: $862,095 - $985,000
2
Beds
1
Bath
945
Sq Ft
$1,005/Sq Ft
Est. Value
About This Home
This home is located at 23831 Boeing Ln, Lake Forest, CA 92630 and is currently estimated at $950,024, approximately $1,005 per square foot. 23831 Boeing Ln is a home located in Orange County with nearby schools including Olivewood Elementary School, Serrano Intermediate School, and El Toro High School.
Ownership History
Date
Name
Owned For
Owner Type
Purchase Details
Closed on
May 13, 2011
Sold by
Wojcik Hieronim L
Bought by
Davis Bruce E and Davis Susan E
Current Estimated Value
Home Financials for this Owner
Home Financials are based on the most recent Mortgage that was taken out on this home.
Original Mortgage
$367,700
Outstanding Balance
$251,734
Interest Rate
4.56%
Mortgage Type
VA
Estimated Equity
$698,290
Purchase Details
Closed on
Mar 10, 2011
Sold by
Wojcik Wojciech and Wojcik Ireneusz J
Bought by
Wojcik Hieronim L
Purchase Details
Closed on
Jun 7, 1995
Sold by
Uroda Yvonne M
Bought by
Wojcik Hieronim L and Wojcik Wojciech
Home Financials for this Owner
Home Financials are based on the most recent Mortgage that was taken out on this home.
Original Mortgage
$100,000
Interest Rate
7.97%
Create a Home Valuation Report for This Property
The Home Valuation Report is an in-depth analysis detailing your home's value as well as a comparison with similar homes in the area
Home Values in the Area
Average Home Value in this Area
Purchase History
| Date | Buyer | Sale Price | Title Company |
|---|---|---|---|
| Davis Bruce E | $360,000 | Western Resources Title | |
| Wojcik Hieronim L | -- | Western Resources Title Co | |
| Wojcik Hieronim L | $138,000 | Commonwealth Land Title |
Source: Public Records
Mortgage History
| Date | Status | Borrower | Loan Amount |
|---|---|---|---|
| Open | Davis Bruce E | $367,700 | |
| Previous Owner | Wojcik Hieronim L | $100,000 |
Source: Public Records
Tax History Compared to Growth
Tax History
| Year | Tax Paid | Tax Assessment Tax Assessment Total Assessment is a certain percentage of the fair market value that is determined by local assessors to be the total taxable value of land and additions on the property. | Land | Improvement |
|---|---|---|---|---|
| 2025 | $4,704 | $461,220 | $388,577 | $72,643 |
| 2024 | $4,704 | $452,177 | $380,958 | $71,219 |
| 2023 | $4,592 | $443,311 | $373,488 | $69,823 |
| 2022 | $4,509 | $434,619 | $366,165 | $68,454 |
| 2021 | $4,418 | $426,098 | $358,986 | $67,112 |
| 2020 | $4,378 | $421,729 | $355,305 | $66,424 |
| 2019 | $4,289 | $413,460 | $348,338 | $65,122 |
| 2018 | $4,208 | $405,353 | $341,507 | $63,846 |
| 2017 | $4,123 | $397,405 | $334,810 | $62,595 |
| 2016 | $4,053 | $389,613 | $328,245 | $61,368 |
| 2015 | $4,003 | $383,761 | $323,314 | $60,447 |
| 2014 | -- | $376,244 | $316,981 | $59,263 |
Source: Public Records
Map
Nearby Homes
- 23981 Crescent Rd
- 23976 Carmel Dr
- 23211 Meadowbrook Cir
- 22682 S Canada Ct
- 22627 Lakeside Ln
- 22661 Pine Lake Ln
- 22576 Lake Forest Ln
- 2222 Via Puerta Unit A
- 2119 Via Puerta Unit N
- 22482 Lake Forest Ln
- 2369 Via Mariposa E Unit 3C
- 2118 Via Puerta
- 22875 Ridge Route Ln
- 2372 Via Mariposa W Unit B
- 23301 Ridge Route Dr Unit 165
- 23301 Ridge Route Dr Unit 215
- 23301 Ridge Route Dr Unit 156
- 23301 Ridge Route Dr Unit 90
- 23301 Ridge Route Dr Unit 95
- 23301 Ridge Route Dr Unit 246
- 23821 Boeing Ln
- 23841 Boeing Ln
- 22982 Starbuck Rd
- 22971 Mullin Rd
- 22961 Mullin Rd
- 22976 Starbuck Rd
- 23832 Boeing Ln
- 23842 Boeing Ln
- 22991 Starbuck Rd
- 22985 Starbuck Rd
- 23822 Boeing Ln
- 23862 Gates St
- 22951 Mullin Rd
- 22972 Starbuck Rd
- 22982 Mullin Rd
- 22992 Mullin Rd
- 22971 Starbuck Rd
- 23812 Boeing Ln
- 23872 Gates St
- 23002 Mullin Rd