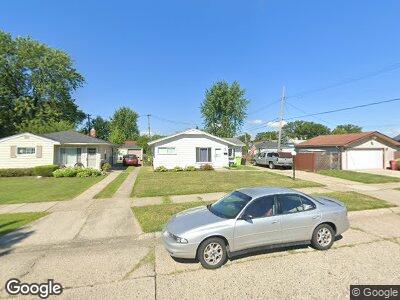
23837 Lexington Ave Unit Bldg-Unit Eastpointe, MI 48021
Estimated Value: $94,000 - $136,000
--
Bed
1
Bath
1,001
Sq Ft
$122/Sq Ft
Est. Value
About This Home
This home is located at 23837 Lexington Ave Unit Bldg-Unit, Eastpointe, MI 48021 and is currently estimated at $122,304, approximately $122 per square foot. 23837 Lexington Ave Unit Bldg-Unit is a home located in Macomb County with nearby schools including Forest Park Elementary School, Eastpointe Middle School, and Reach Charter Academy.
Ownership History
Date
Name
Owned For
Owner Type
Purchase Details
Closed on
Mar 16, 2018
Sold by
Toma Gjonaj and Gjonaj Toma
Bought by
Solomon Kristin N
Current Estimated Value
Home Financials for this Owner
Home Financials are based on the most recent Mortgage that was taken out on this home.
Original Mortgage
$54,003
Interest Rate
4.25%
Mortgage Type
FHA
Purchase Details
Closed on
Sep 1, 2017
Sold by
Gray Jamie and Gray Kimberly
Bought by
Gjonaj Tonia and Gjonaj Jamie
Purchase Details
Closed on
Feb 13, 2017
Sold by
Champine Nicholas Lee
Bought by
Gray Kimberly M
Purchase Details
Closed on
Nov 10, 2014
Sold by
Jackbowski Megan
Bought by
Gjounj Tom A
Purchase Details
Closed on
May 30, 2014
Sold by
Wasserman Holdings Llc
Bought by
Toma Gjonaj
Purchase Details
Closed on
Oct 12, 2009
Sold by
Wtotw Homes Llc
Bought by
Wasserman Holdings Llc
Create a Home Valuation Report for This Property
The Home Valuation Report is an in-depth analysis detailing your home's value as well as a comparison with similar homes in the area
Home Values in the Area
Average Home Value in this Area
Purchase History
| Date | Buyer | Sale Price | Title Company |
|---|---|---|---|
| Solomon Kristin N | $55,000 | Estates Title Agency | |
| Gjonaj Tonia | -- | Estates Title Agency | |
| Gray Kimberly M | -- | None Available | |
| Gjounj Tom A | -- | Estates Title Agency | |
| Toma Gjonaj | $30,000 | Devon Title Agency | |
| Wasserman Holdings Llc | $19,000 | Bell Title |
Source: Public Records
Mortgage History
| Date | Status | Borrower | Loan Amount |
|---|---|---|---|
| Previous Owner | Soloman Kristin N | $54,003 | |
| Previous Owner | Solomon Kristin N | $6,500 |
Source: Public Records
Tax History Compared to Growth
Tax History
| Year | Tax Paid | Tax Assessment Tax Assessment Total Assessment is a certain percentage of the fair market value that is determined by local assessors to be the total taxable value of land and additions on the property. | Land | Improvement |
|---|---|---|---|---|
| 2024 | $1,516 | $53,900 | $0 | $0 |
| 2023 | $1,468 | $46,000 | $0 | $0 |
| 2022 | $1,530 | $38,600 | $0 | $0 |
| 2021 | $1,507 | $33,700 | $0 | $0 |
| 2020 | $1,440 | $31,500 | $0 | $0 |
| 2019 | $1,432 | $26,900 | $0 | $0 |
| 2018 | $1,558 | $24,200 | $0 | $0 |
| 2017 | $1,745 | $22,360 | $3,670 | $18,690 |
| 2016 | $1,670 | $22,360 | $0 | $0 |
| 2015 | $1,304 | $20,570 | $0 | $0 |
| 2013 | $1,411 | $20,040 | $0 | $0 |
Source: Public Records
Map
Nearby Homes
- 17941 Stephens Dr
- 23708 Lexington Ave
- 23708 Rosalind Ave
- 23320 Lexington Ave
- 23162 Normandy Ave
- 23756 Brittany Ave
- 23100 Schroeder Ave
- 24572 Rosalind Ave
- 23078 Rosalind Ave
- 24310 Brittany Ave
- 23031 Rosalind Ave
- 23022 Lexington Ave
- 24511 Brittany Ave
- 24640 Wilmot Ave
- 24648 Wilmot Ave
- 24584 Brittany Ave
- 23006 Rosalind Ave
- 23139 Tuscany Ave
- 24607 Tuscany Ave
- 23147 Lambrecht Ave
- 23837 Lexington Ave Unit Bldg-Unit
- 23837 Lexington Ave
- 23829 Lexington Ave
- 18038 Stephens Dr
- 23821 Lexington Ave
- 18046 Stephens Dr
- 18054 Stephens Dr
- 18030 Stephens Dr
- 23811 Lexington Ave
- 23838 Wilmot Ave
- 23828 Wilmot Ave
- 23836 Lexington Ave
- 18022 Stephens Dr
- 18118 Stephens Dr
- 23820 Wilmot Ave
- 18014 Stephens Dr
- 23801 Lexington Ave
- 18126 Stephens Dr Unit Bldg-Unit
- 18126 Stephens Dr
- 23820 Lexington Ave