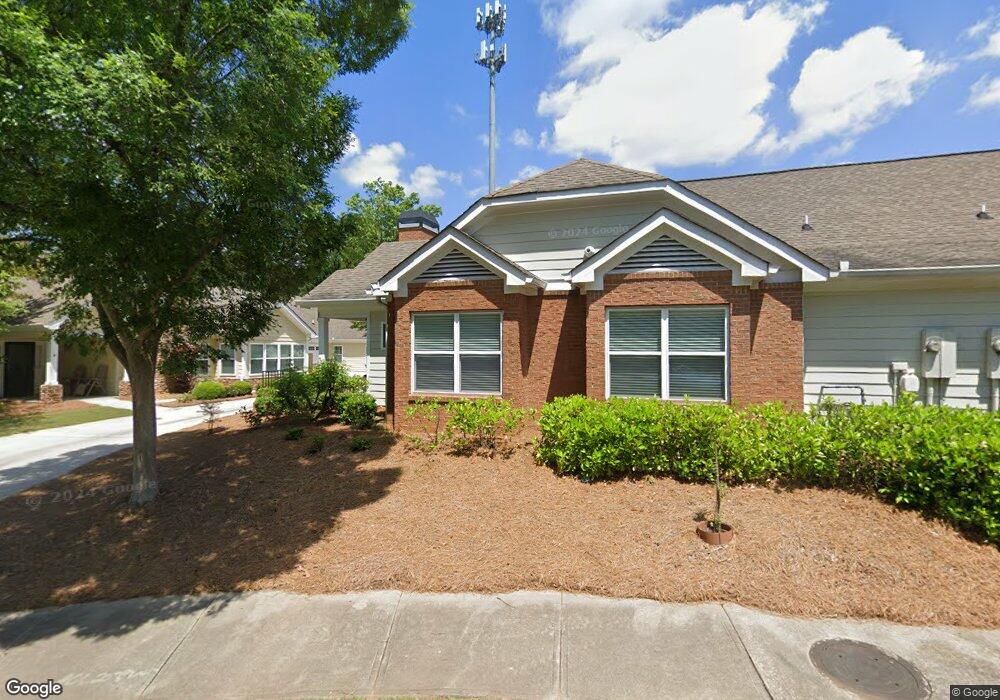
2384 Chimney Cottage Cir NE Unit 2 Marietta, GA 30066
Sandy Plains NeighborhoodEstimated Value: $304,000 - $431,000
2
Beds
2
Baths
1,736
Sq Ft
$214/Sq Ft
Est. Value
About This Home
This home is located at 2384 Chimney Cottage Cir NE Unit 2, Marietta, GA 30066 and is currently estimated at $370,928, approximately $213 per square foot. 2384 Chimney Cottage Cir NE Unit 2 is a home located in Cobb County with nearby schools including Blackwell Elementary School, Daniell Middle School, and Sprayberry High School.
Ownership History
Date
Name
Owned For
Owner Type
Purchase Details
Closed on
Aug 19, 2016
Sold by
Colleen
Bought by
Sidley Colleen
Current Estimated Value
Purchase Details
Closed on
Aug 10, 2015
Sold by
Frutchey Martha J
Bought by
Sidley Colleen R
Purchase Details
Closed on
Dec 19, 2012
Sold by
Frutchey Martha J
Bought by
Frutchey Martha J and Frutchey Alan C
Purchase Details
Closed on
Jul 20, 2012
Sold by
Federal Deposit Insurance Corporation
Bought by
Community & Southern Bank
Purchase Details
Closed on
Oct 13, 2005
Sold by
Hampton Hms Inc
Bought by
Stehouwer Mary W
Home Financials for this Owner
Home Financials are based on the most recent Mortgage that was taken out on this home.
Original Mortgage
$68,000
Interest Rate
5.76%
Mortgage Type
New Conventional
Create a Home Valuation Report for This Property
The Home Valuation Report is an in-depth analysis detailing your home's value as well as a comparison with similar homes in the area
Home Values in the Area
Average Home Value in this Area
Purchase History
| Date | Buyer | Sale Price | Title Company |
|---|---|---|---|
| Sidley Colleen | -- | -- | |
| Sidley Colleen R | $200,000 | -- | |
| Sidley Colleen R | $200,000 | -- | |
| Frutchey Martha J | -- | -- | |
| Community & Southern Bank | -- | -- | |
| Stehouwer Mary W | $198,000 | -- |
Source: Public Records
Mortgage History
| Date | Status | Borrower | Loan Amount |
|---|---|---|---|
| Previous Owner | Stehouwer Mary W | $68,000 |
Source: Public Records
Tax History Compared to Growth
Tax History
| Year | Tax Paid | Tax Assessment Tax Assessment Total Assessment is a certain percentage of the fair market value that is determined by local assessors to be the total taxable value of land and additions on the property. | Land | Improvement |
|---|---|---|---|---|
| 2024 | $823 | $117,592 | $28,000 | $89,592 |
| 2023 | $617 | $117,592 | $28,000 | $89,592 |
| 2022 | $823 | $117,592 | $28,000 | $89,592 |
| 2021 | $722 | $83,892 | $24,000 | $59,892 |
| 2020 | $722 | $83,892 | $24,000 | $59,892 |
| 2019 | $722 | $83,892 | $24,000 | $59,892 |
| 2018 | $700 | $76,480 | $24,000 | $52,480 |
| 2017 | $613 | $76,480 | $24,000 | $52,480 |
| 2016 | $606 | $73,716 | $24,000 | $49,716 |
| 2015 | $571 | $65,716 | $16,000 | $49,716 |
| 2014 | $1,476 | $58,500 | $0 | $0 |
Source: Public Records
Map
Nearby Homes
- 1100 Sallete Ct
- 0000 Oland Cir
- 844 Kurtz Rd
- 0 Oland Cir Unit 10570943
- 551 Duke Dr
- 921 Chesterfield Dr
- 2047 Kingswood Dr
- 2813 New South Dr
- 2813 New Dr S
- 2037 Kingswood Dr
- 2659 Bethel Ct
- 2391 Black Oak Dr
- 2642 Morgan Rd NE
- 2018 Darrell Dr
- 2850 Seagrave Way
- 2388 Black Oak Dr
- 1854 Addison Rd NE
- 721 Ruby St
- 2390 Morgan Rd NE
- 2170 Northfield Ct
- 2376 Chimney Cottage Cir NE Unit 2
- 2382 Chimney Cottage Cir NE Unit 2
- 2378 Chimney Cottage Cir NE Unit 2
- 2386 Chimney Cottage Circle Ne #4
- 2386 Chimney Cottage Cir NE Unit 1
- 2386 Chimney Cottage Cir NE Unit 4
- 2386 Chimeny Cottage Center NE Unit 4
- 2388 Chimney Cottage Cir NE Unit 3
- 2388 Chimney Cottage Cir NE Unit 1
- 2374 Chimney Cottage Cir NE Unit 3
- 2374 Chimney Cottage Cir NE Unit 9
- 2394 Chimney Cottage Cir NE Unit 1
- 2392 Chimney Cottage Cir NE Unit 1
- 2372 Chimney Cottage Cir NE Unit 3
- 2366 Chimney Cottage Cir NE Unit 3
- 2366 Chimney Cottage Cir NE Unit 12
- 2368 Chimney Cottage Cir NE Unit 3
- 2377 Chimney Cottage Cir NE Unit 56
- 2377 Chimney Cottage Cir NE Unit 15
- 2375 Chimney Cottage Cir NE Unit 55