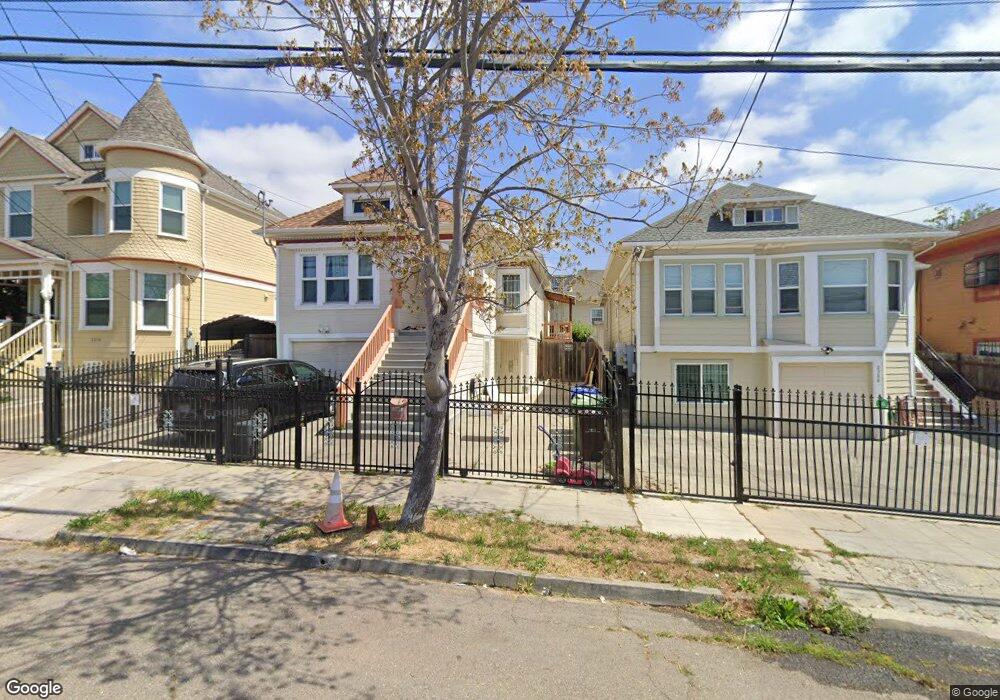
2384 E 22nd St Oakland, CA 94601
Meadow Brook NeighborhoodEstimated Value: $496,000 - $767,000
6
Beds
4
Baths
2,371
Sq Ft
$280/Sq Ft
Est. Value
About This Home
This home is located at 2384 E 22nd St, Oakland, CA 94601 and is currently estimated at $664,886, approximately $280 per square foot. 2384 E 22nd St is a home located in Alameda County with nearby schools including Manzanita Community School, Manzanita Seed Elementary School, and Roosevelt Middle School.
Ownership History
Date
Name
Owned For
Owner Type
Purchase Details
Closed on
Nov 4, 2015
Sold by
Ung Tim and Ung Sandra Ho
Bought by
Jiang Shiming
Current Estimated Value
Home Financials for this Owner
Home Financials are based on the most recent Mortgage that was taken out on this home.
Original Mortgage
$156,000
Outstanding Balance
$125,580
Interest Rate
4.5%
Mortgage Type
Adjustable Rate Mortgage/ARM
Estimated Equity
$539,306
Purchase Details
Closed on
May 20, 2004
Sold by
Johnson Nellie and Estate Of Alvis Garrison Sr
Bought by
Ung Tim and Ung Sandra Ho
Home Financials for this Owner
Home Financials are based on the most recent Mortgage that was taken out on this home.
Original Mortgage
$208,000
Interest Rate
5.86%
Mortgage Type
Purchase Money Mortgage
Create a Home Valuation Report for This Property
The Home Valuation Report is an in-depth analysis detailing your home's value as well as a comparison with similar homes in the area
Home Values in the Area
Average Home Value in this Area
Purchase History
| Date | Buyer | Sale Price | Title Company |
|---|---|---|---|
| Jiang Shiming | $260,000 | Chicago Title Company | |
| Ung Tim | $260,000 | First American Title Company |
Source: Public Records
Mortgage History
| Date | Status | Borrower | Loan Amount |
|---|---|---|---|
| Open | Jiang Shiming | $156,000 | |
| Previous Owner | Ung Tim | $208,000 |
Source: Public Records
Tax History
| Year | Tax Paid | Tax Assessment Tax Assessment Total Assessment is a certain percentage of the fair market value that is determined by local assessors to be the total taxable value of land and additions on the property. | Land | Improvement |
|---|---|---|---|---|
| 2025 | $8,452 | $494,360 | $115,417 | $385,943 |
| 2024 | $8,452 | $484,531 | $113,154 | $378,377 |
| 2023 | $8,793 | $481,895 | $110,936 | $370,959 |
| 2022 | $8,467 | $465,447 | $108,761 | $363,686 |
| 2021 | $7,982 | $456,183 | $106,628 | $356,555 |
| 2020 | $7,891 | $458,436 | $105,535 | $352,901 |
| 2019 | $7,522 | $449,450 | $103,467 | $345,983 |
| 2018 | $7,365 | $440,640 | $101,439 | $339,201 |
| 2017 | $6,869 | $432,000 | $99,450 | $332,550 |
| 2016 | $5,276 | $325,000 | $97,500 | $227,500 |
| 2015 | $5,066 | $300,000 | $90,000 | $210,000 |
| 2014 | $4,583 | $260,000 | $78,000 | $182,000 |
Source: Public Records
Map
Nearby Homes
Your Personal Tour Guide
Ask me questions while you tour the home.