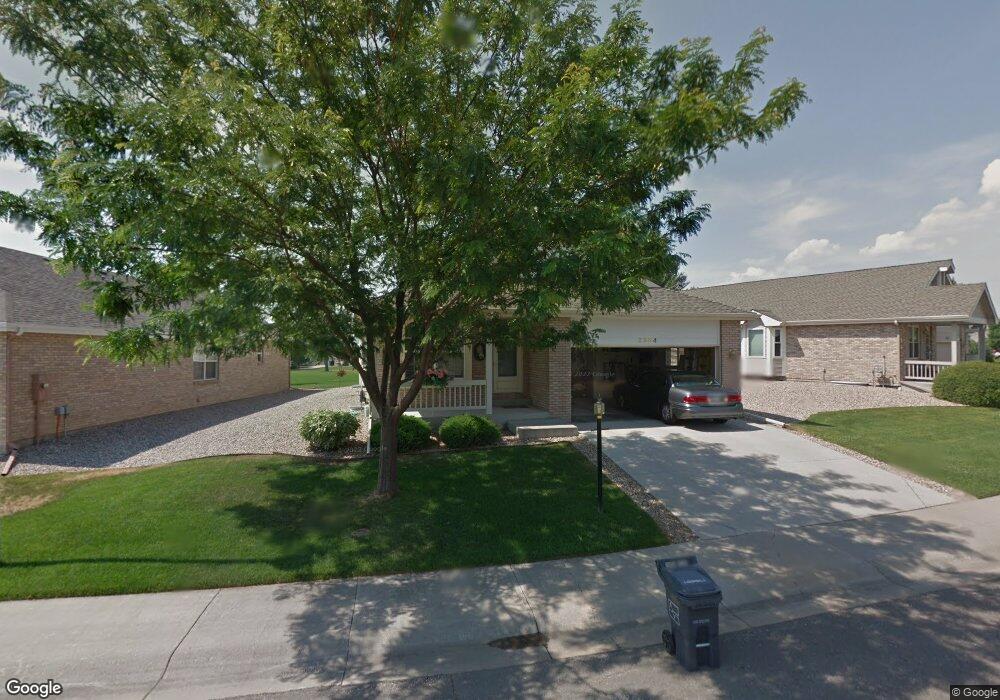
2384 Waverly Dr Loveland, CO 80538
Estimated Value: $444,471 - $484,000
2
Beds
2
Baths
1,432
Sq Ft
$327/Sq Ft
Est. Value
About This Home
This home is located at 2384 Waverly Dr, Loveland, CO 80538 and is currently estimated at $468,618, approximately $327 per square foot. 2384 Waverly Dr is a home located in Larimer County with nearby schools including Centennial Elementary School, Lucile Erwin Middle School, and Loveland High School.
Ownership History
Date
Name
Owned For
Owner Type
Purchase Details
Closed on
Jun 30, 1998
Sold by
Glen Meadows Project Llc
Bought by
Poor Karlene A and Poor Alexander
Current Estimated Value
Home Financials for this Owner
Home Financials are based on the most recent Mortgage that was taken out on this home.
Original Mortgage
$60,000
Interest Rate
6.79%
Purchase Details
Closed on
Apr 17, 1998
Sold by
Chambers Development Llc
Bought by
Glen Meadows Project Llc
Home Financials for this Owner
Home Financials are based on the most recent Mortgage that was taken out on this home.
Original Mortgage
$110,472
Interest Rate
7.21%
Mortgage Type
Construction
Purchase Details
Closed on
Feb 1, 1996
Sold by
Security Title Guaranty Co Trustee
Bought by
Glen Properties Inc
Purchase Details
Closed on
Dec 1, 1995
Sold by
Glen Properties Inc
Bought by
Landvest
Purchase Details
Closed on
Jun 1, 1995
Sold by
Security Title Guaranty Co Trustee
Bought by
Glen Properties Inc
Create a Home Valuation Report for This Property
The Home Valuation Report is an in-depth analysis detailing your home's value as well as a comparison with similar homes in the area
Home Values in the Area
Average Home Value in this Area
Purchase History
| Date | Buyer | Sale Price | Title Company |
|---|---|---|---|
| Poor Karlene A | $160,930 | Security Title | |
| Glen Meadows Project Llc | $120,000 | -- | |
| Glen Properties Inc | -- | -- | |
| Landvest | $182,800 | -- | |
| Glen Properties Inc | $670,900 | -- |
Source: Public Records
Mortgage History
| Date | Status | Borrower | Loan Amount |
|---|---|---|---|
| Closed | Poor Karlene A | $60,000 | |
| Previous Owner | Glen Meadows Project Llc | $110,472 |
Source: Public Records
Tax History Compared to Growth
Tax History
| Year | Tax Paid | Tax Assessment Tax Assessment Total Assessment is a certain percentage of the fair market value that is determined by local assessors to be the total taxable value of land and additions on the property. | Land | Improvement |
|---|---|---|---|---|
| 2025 | $1,701 | $31,704 | $2,626 | $29,078 |
| 2024 | $1,641 | $31,704 | $2,626 | $29,078 |
| 2022 | $1,331 | $23,671 | $2,724 | $20,947 |
| 2021 | $1,367 | $24,353 | $2,803 | $21,550 |
| 2020 | $1,464 | $25,561 | $2,803 | $22,758 |
| 2019 | $1,439 | $25,561 | $2,803 | $22,758 |
| 2018 | $1,233 | $22,183 | $2,822 | $19,361 |
| 2017 | $1,062 | $22,183 | $2,822 | $19,361 |
| 2016 | $978 | $21,293 | $3,120 | $18,173 |
| 2015 | $970 | $21,290 | $3,120 | $18,170 |
| 2014 | $814 | $18,790 | $3,120 | $15,670 |
Source: Public Records
Map
Nearby Homes
- 2465 Glen Isle Dr
- 3902 Penrose Ave
- 3890 Kremmling Dr
- 2250 W 44th St
- 2554 W 44th St
- 2070 Tonopas Ct
- 4559 Keota Place
- 2643 W 45th St
- 2684 W 46th St
- 3679 Wild Horse Ct Unit 3679
- 2597 W 46th St
- 2617 W 36th St
- 4106 Cripple Creek Dr
- 3477 Pinecliffe Ave
- 3007 Benfold St
- 2960 Kincaid Dr Unit 303
- 1555 Oak Creek Dr
- 1532 Oak Creek Dr
- 4719 Degas Dr
- 2920 Donatello St
- 2368 Waverly Dr
- 2410 Waverly Dr
- 2442 Waverly Dr
- 2393 Waverly Dr
- 2379 Waverly Dr
- 2407 Waverly Dr
- 2365 Waverly Dr
- 2342 Waverly Dr
- 2421 Waverly Dr
- 2351 Waverly Dr
- 2435 Waverly Dr
- 2330 Waverly Dr
- 2337 Waverly Dr
- 2449 Waverly Dr
- 2437 Lawson Dr
- 2449 Lawson Dr
- 2423 Lawson Dr
- 2465 Lawson Dr
- 2411 Lawson Dr
- 2323 Waverly Dr