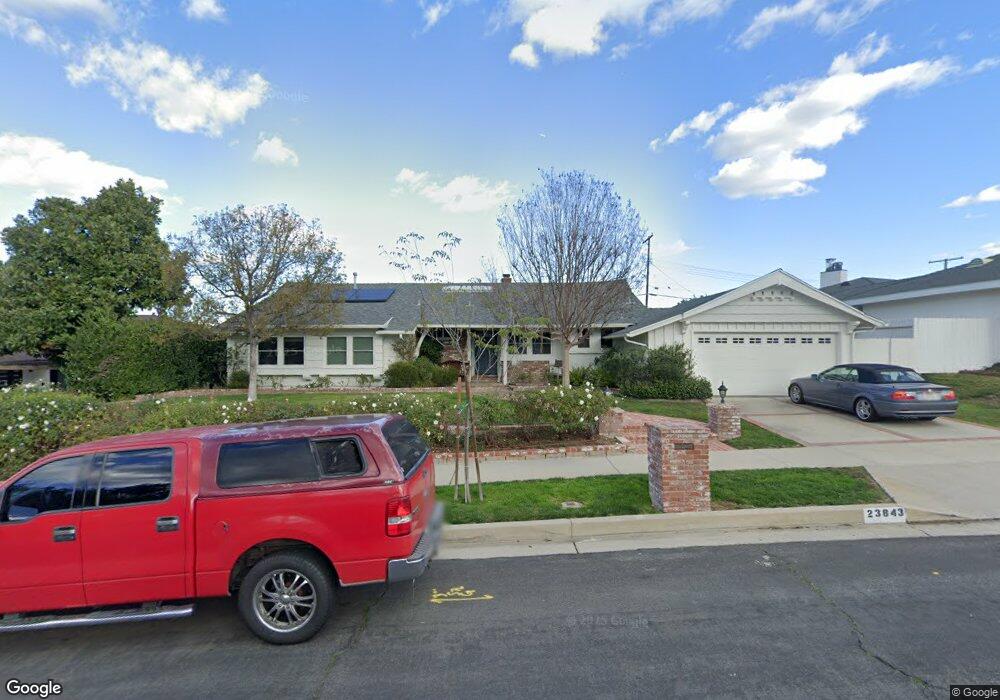
23843 Crosson Dr Woodland Hills, CA 91367
Estimated Value: $1,311,000 - $1,408,715
3
Beds
3
Baths
1,919
Sq Ft
$707/Sq Ft
Est. Value
About This Home
This home is located at 23843 Crosson Dr, Woodland Hills, CA 91367 and is currently estimated at $1,357,679, approximately $707 per square foot. 23843 Crosson Dr is a home located in Los Angeles County with nearby schools including Lockhurst Drive Charter Elementary, Woodlake Elementary Community Charter, and Haynes Charter For Enriched Studies.
Ownership History
Date
Name
Owned For
Owner Type
Purchase Details
Closed on
Jul 29, 2022
Sold by
Johnson Jill H
Bought by
Jill Hope Johnson Revocable Trust
Current Estimated Value
Purchase Details
Closed on
Feb 22, 2011
Sold by
Davies Nancy Susan and The Nancy Susan Davies Dynasty
Bought by
Johnson Jill H
Home Financials for this Owner
Home Financials are based on the most recent Mortgage that was taken out on this home.
Original Mortgage
$375,000
Interest Rate
5.02%
Mortgage Type
New Conventional
Purchase Details
Closed on
Dec 29, 2010
Sold by
Davies Nancy Susan and The Evans Family Trust
Bought by
Davies Nancy Susan and The Nancy Susan Davies Dynasty
Home Financials for this Owner
Home Financials are based on the most recent Mortgage that was taken out on this home.
Original Mortgage
$375,000
Interest Rate
5.02%
Mortgage Type
New Conventional
Create a Home Valuation Report for This Property
The Home Valuation Report is an in-depth analysis detailing your home's value as well as a comparison with similar homes in the area
Home Values in the Area
Average Home Value in this Area
Purchase History
| Date | Buyer | Sale Price | Title Company |
|---|---|---|---|
| Jill Hope Johnson Revocable Trust | -- | None Listed On Document | |
| Johnson Jill H | $647,000 | California Title Company | |
| Davies Nancy Susan | -- | None Available |
Source: Public Records
Mortgage History
| Date | Status | Borrower | Loan Amount |
|---|---|---|---|
| Previous Owner | Johnson Jill H | $375,000 |
Source: Public Records
Tax History Compared to Growth
Tax History
| Year | Tax Paid | Tax Assessment Tax Assessment Total Assessment is a certain percentage of the fair market value that is determined by local assessors to be the total taxable value of land and additions on the property. | Land | Improvement |
|---|---|---|---|---|
| 2025 | $10,165 | $828,908 | $476,461 | $352,447 |
| 2024 | $10,165 | $812,656 | $467,119 | $345,537 |
| 2023 | $9,972 | $796,722 | $457,960 | $338,762 |
| 2022 | $9,516 | $781,101 | $448,981 | $332,120 |
| 2021 | $9,396 | $765,786 | $440,178 | $325,608 |
| 2019 | $9,119 | $743,074 | $427,123 | $315,951 |
| 2018 | $8,967 | $728,505 | $418,749 | $309,756 |
| 2016 | $8,567 | $700,219 | $402,490 | $297,729 |
| 2015 | $8,443 | $689,702 | $396,445 | $293,257 |
| 2014 | $8,475 | $676,193 | $388,680 | $287,513 |
Source: Public Records
Map
Nearby Homes
- 23853 Hatteras St
- 23952 Nomar St
- 23717 Crosson Dr
- 5929 Adler Ave
- 5700 El Canon Ave
- 5831 Elba Place
- 5534 Pattilar Ave
- 5630 Blanco Ave
- 6022 Elba Place
- 5622 Le Sage Ave
- 5931 Neddy Ave
- 23812 Calvert St
- 6020 Neddy Ave
- 6001 Manton Ave
- 6009 Neddy Ave
- 5540 Franrivers Ave
- 6153 Debs Ave
- 23701 Clarendon St
- 23721 Mariano St
- 24221 Aetna St
- 23839 Crosson Dr
- 23847 Crosson Dr
- 23833 Crosson Dr
- 23853 Crosson Dr
- 5761 Larryan Dr
- 23829 Crosson Dr
- 23930 Nomar St
- 5760 Larryan Dr
- 23857 Crosson Dr
- 5757 Larryan Dr
- 23825 Crosson Dr
- 23832 Crosson Dr
- 23936 Nomar St
- 23861 Crosson Dr
- 5756 Larryan Dr
- 5753 Larryan Dr
- 23826 Crosson Dr
- 23821 Crosson Dr
- 23940 Nomar St
- 5712 Larryan Dr