23843 Oxnard St Woodland Hills, CA 91367
Estimated Value: $1,111,000 - $1,424,000
4
Beds
3
Baths
2,098
Sq Ft
$622/Sq Ft
Est. Value
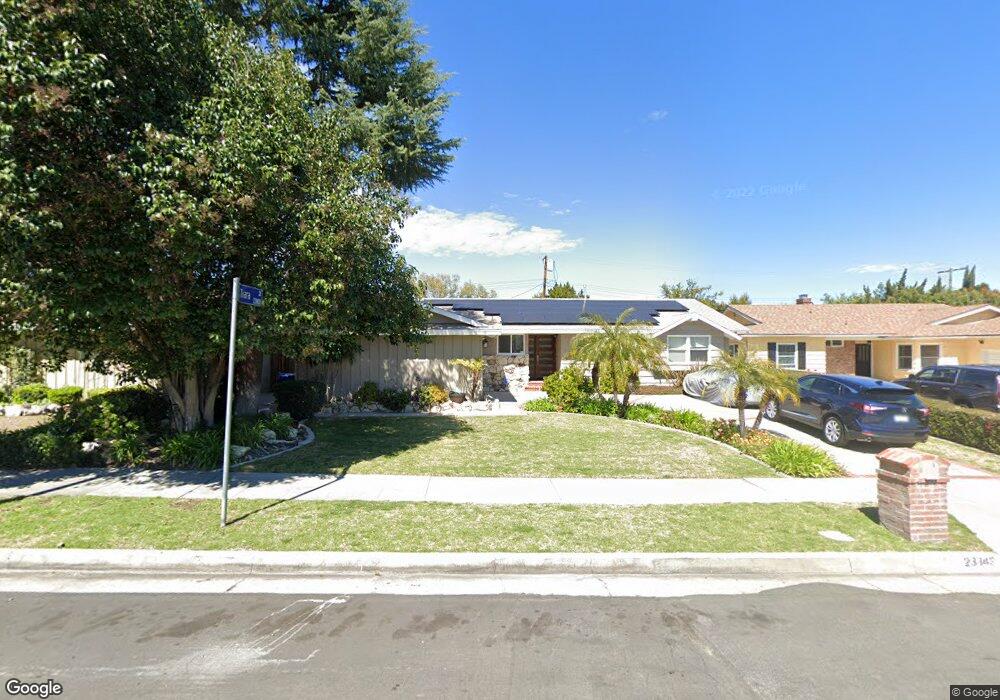
About This Home
This home is located at 23843 Oxnard St, Woodland Hills, CA 91367 and is currently estimated at $1,303,910, approximately $621 per square foot. 23843 Oxnard St is a home located in Los Angeles County with nearby schools including Lockhurst Drive Charter Elementary, Woodlake Elementary Community Charter, and Haynes Charter For Enriched Studies.
Ownership History
Date
Name
Owned For
Owner Type
Purchase Details
Closed on
Jun 26, 2004
Sold by
Pime Matthew J
Bought by
Pime Matthew J
Current Estimated Value
Home Financials for this Owner
Home Financials are based on the most recent Mortgage that was taken out on this home.
Original Mortgage
$415,000
Outstanding Balance
$195,695
Interest Rate
5.37%
Mortgage Type
New Conventional
Estimated Equity
$1,108,215
Purchase Details
Closed on
Nov 19, 2002
Sold by
Magon Bradley J and Belanger Magon Karen M
Bought by
Pime Matthew J
Home Financials for this Owner
Home Financials are based on the most recent Mortgage that was taken out on this home.
Original Mortgage
$373,500
Interest Rate
5.81%
Purchase Details
Closed on
Sep 19, 1994
Sold by
Newhoff Harry R and Newhoff Denise
Bought by
Magon Bradley J
Home Financials for this Owner
Home Financials are based on the most recent Mortgage that was taken out on this home.
Original Mortgage
$237,500
Interest Rate
8.55%
Create a Home Valuation Report for This Property
The Home Valuation Report is an in-depth analysis detailing your home's value as well as a comparison with similar homes in the area
Home Values in the Area
Average Home Value in this Area
Purchase History
| Date | Buyer | Sale Price | Title Company |
|---|---|---|---|
| Pime Matthew J | -- | Security Union | |
| Pime Matthew J | $415,000 | California Title | |
| Magon Bradley J | $250,000 | Gateway Title |
Source: Public Records
Mortgage History
| Date | Status | Borrower | Loan Amount |
|---|---|---|---|
| Open | Pime Matthew J | $415,000 | |
| Closed | Pime Matthew J | $373,500 | |
| Previous Owner | Magon Bradley J | $237,500 |
Source: Public Records
Tax History Compared to Growth
Tax History
| Year | Tax Paid | Tax Assessment Tax Assessment Total Assessment is a certain percentage of the fair market value that is determined by local assessors to be the total taxable value of land and additions on the property. | Land | Improvement |
|---|---|---|---|---|
| 2025 | $8,680 | $709,262 | $399,873 | $309,389 |
| 2024 | $8,680 | $695,356 | $392,033 | $303,323 |
| 2023 | $8,514 | $681,723 | $384,347 | $297,376 |
| 2022 | $8,123 | $668,357 | $376,811 | $291,546 |
| 2021 | $8,017 | $655,253 | $369,423 | $285,830 |
| 2019 | $7,779 | $635,820 | $358,467 | $277,353 |
| 2018 | $6,498 | $528,237 | $351,439 | $176,798 |
| 2016 | $15,928 | $507,728 | $337,794 | $169,934 |
| 2015 | $6,113 | $500,103 | $332,721 | $167,382 |
| 2014 | $6,137 | $490,308 | $326,204 | $164,104 |
Source: Public Records
Map
Nearby Homes
- 23812 Calvert St
- 5929 Adler Ave
- 6022 Elba Place
- 6001 Manton Ave
- 6153 Debs Ave
- 6236 Kenwater Ave
- 23952 Nomar St
- 23853 Hatteras St
- 24017 Sylvan St
- 6020 Neddy Ave
- 5831 Elba Place
- 5931 Neddy Ave
- 6009 Neddy Ave
- 23717 Crosson Dr
- 6227 Glide Ave
- 24244 Friar St
- 5700 El Canon Ave
- 24221 Aetna St
- 23416 Califa St
- 6416 Kenwater Place
- 23839 Oxnard St
- 23847 Oxnard St
- 23848 Aetna St
- 23835 Oxnard St
- 23855 Oxnard St
- 23862 Aetna St
- 23851 Tiara St
- 23842 Aetna St
- 23831 W Oxnard St
- 23831 Oxnard St
- 23870 Aetna St
- 23866 Tiara St
- 23836 Aetna St
- 23847 Tiara St
- 23824 Oxnard St
- 23901 Oxnard St
- 23901 W Oxnard St
- 23827 Oxnard St
- 23860 Tiara St
- 23874 Aetna St