Estimated Value: $258,260 - $378,000
--
Bed
--
Bath
893
Sq Ft
$347/Sq Ft
Est. Value
About This Home
This home is located at 2385 Barker Ave Unit 1W, Bronx, NY 10467 and is currently estimated at $309,565, approximately $346 per square foot. 2385 Barker Ave Unit 1W is a home located in Bronx County with nearby schools including P.S. 96 The Richard Rodgers School, Pelham Academy, and Bronx Green Middle School.
Ownership History
Date
Name
Owned For
Owner Type
Purchase Details
Closed on
Dec 10, 2003
Sold by
Nooks Paul and Wiggins-Nooks Candy
Bought by
Meikle Martinette A
Current Estimated Value
Home Financials for this Owner
Home Financials are based on the most recent Mortgage that was taken out on this home.
Original Mortgage
$166,250
Interest Rate
6.3%
Mortgage Type
Purchase Money Mortgage
Purchase Details
Closed on
Jan 9, 2002
Sold by
Wiggins Candy
Bought by
Wiggins-Nooks Candy and Nooks Paul
Purchase Details
Closed on
Jan 30, 2001
Sold by
Baring Holdings Llc
Bought by
Wiggins Candy
Home Financials for this Owner
Home Financials are based on the most recent Mortgage that was taken out on this home.
Original Mortgage
$67,500
Interest Rate
7%
Create a Home Valuation Report for This Property
The Home Valuation Report is an in-depth analysis detailing your home's value as well as a comparison with similar homes in the area
Home Values in the Area
Average Home Value in this Area
Purchase History
| Date | Buyer | Sale Price | Title Company |
|---|---|---|---|
| Meikle Martinette A | $175,000 | -- | |
| Wiggins-Nooks Candy | -- | -- | |
| Wiggins Candy | $75,000 | -- |
Source: Public Records
Mortgage History
| Date | Status | Borrower | Loan Amount |
|---|---|---|---|
| Previous Owner | Meikle Martinette A | $166,250 | |
| Previous Owner | Wiggins Candy | $67,500 |
Source: Public Records
Tax History Compared to Growth
Tax History
| Year | Tax Paid | Tax Assessment Tax Assessment Total Assessment is a certain percentage of the fair market value that is determined by local assessors to be the total taxable value of land and additions on the property. | Land | Improvement |
|---|---|---|---|---|
| 2025 | $3,283 | $28,295 | $2,415 | $25,880 |
| 2024 | $3,283 | $28,579 | $2,415 | $26,164 |
| 2023 | $2,245 | $27,774 | $2,415 | $25,359 |
| 2022 | $2,163 | $27,373 | $2,415 | $24,958 |
| 2021 | $2,638 | $23,962 | $2,415 | $21,547 |
| 2020 | $1,692 | $29,011 | $2,415 | $26,596 |
| 2019 | $2,060 | $27,275 | $2,415 | $24,860 |
| 2018 | $2,689 | $27,209 | $2,414 | $24,795 |
| 2017 | $2,553 | $25,819 | $2,414 | $23,405 |
| 2016 | $2,294 | $24,766 | $2,414 | $22,352 |
| 2015 | $1,272 | $20,171 | $2,415 | $17,756 |
| 2014 | $1,272 | $19,422 | $2,415 | $17,007 |
Source: Public Records
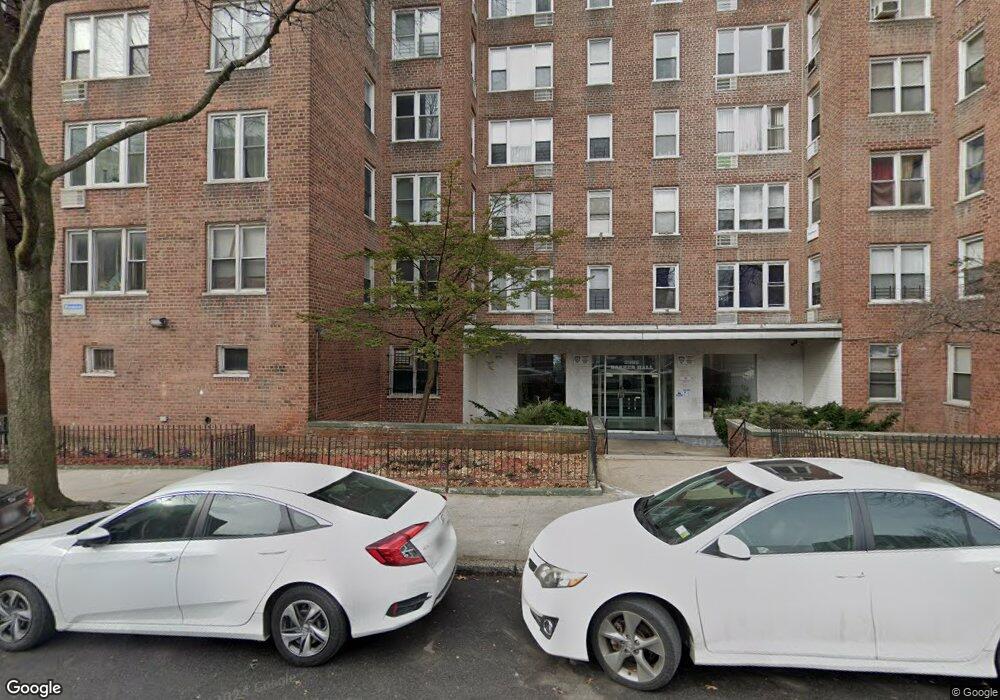
About This Building
Map
Nearby Homes
- 2385 Barker Ave Unit 6B
- 2385 Barker Ave Unit 1D
- 2385 Barker Ave Unit 5L
- 610 Waring Ave Unit 4F
- 610 Waring Ave Unit 2T
- 610 Waring Ave Unit 5F
- 610 Waring Ave Unit 6C
- 665 Thwaites Place Unit 4V
- 665 Thwaites Place Unit 1X
- 2244 Bronx Park E Unit 1-B
- 2244 Bronx Park E Unit 1E
- 2244 Bronx Park E Unit 6L
- 601 Pelham Pkwy N Unit 305
- 601 Pelham Pkwy N Unit 106
- 601 Pelham Pkwy N Unit 514
- 601 Pelham Pkwy N Unit 516
- 601 Pelham Pkwy N Unit 415
- 2315 Wallace Ave
- 2550 Olinville Ave Unit 4G
- 2550 Olinville Ave Unit 8M
- 2385 Barker Ave Unit LB
- 2385 Barker Ave Unit LA
- 2385 Barker Ave Unit 6W
- 2385 Barker Ave Unit 5W
- 2385 Barker Ave Unit 4W
- 2385 Barker Ave Unit 3W
- 2385 Barker Ave Unit 2W
- 2385 Barker Ave Unit 6V
- 2385 Barker Ave Unit 5V
- 2385 Barker Ave Unit 4V
- 2385 Barker Ave Unit 3V
- 2385 Barker Ave Unit 2V
- 2385 Barker Ave Unit 1V
- 2385 Barker Ave Unit 6U
- 2385 Barker Ave Unit 5U
- 2385 Barker Ave Unit 4U
- 2385 Barker Ave Unit 3U
- 2385 Barker Ave Unit 2U
- 2385 Barker Ave Unit 1U
- 2385 Barker Ave Unit 6T