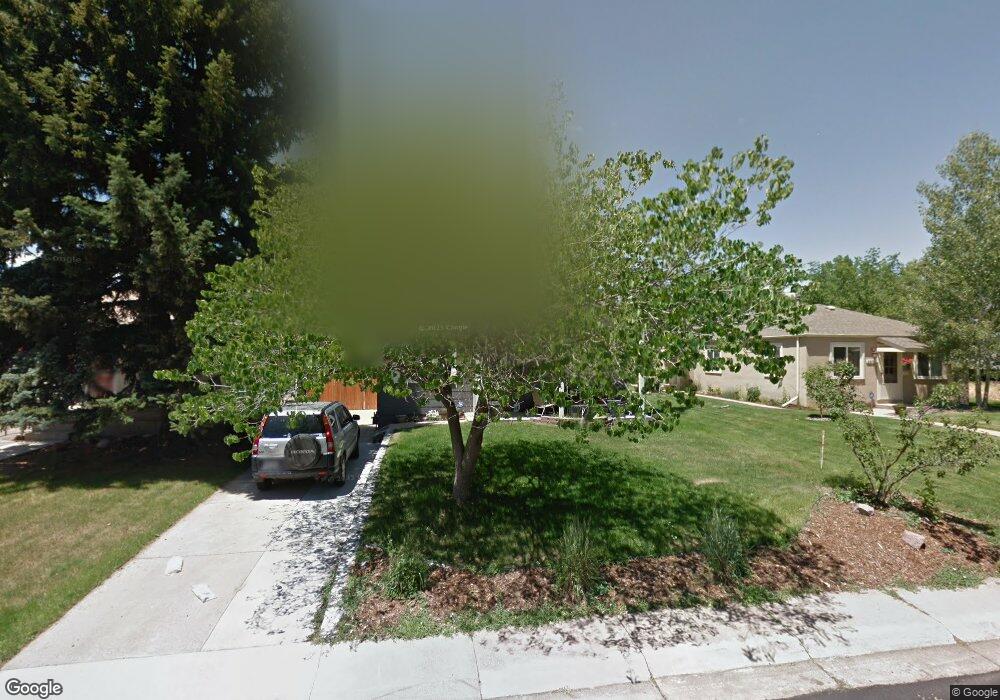
2385 S Corona St Denver, CO 80210
Rosedale NeighborhoodEstimated Value: $602,807 - $738,000
3
Beds
2
Baths
1,456
Sq Ft
$476/Sq Ft
Est. Value
About This Home
This home is located at 2385 S Corona St, Denver, CO 80210 and is currently estimated at $693,452, approximately $476 per square foot. 2385 S Corona St is a home located in Denver County with nearby schools including Asbury Elementary School, Grant Beacon Middle School, and South High School.
Ownership History
Date
Name
Owned For
Owner Type
Purchase Details
Closed on
Feb 12, 2018
Sold by
Bird Ryan L
Bought by
Pudlik Danielle
Current Estimated Value
Home Financials for this Owner
Home Financials are based on the most recent Mortgage that was taken out on this home.
Original Mortgage
$437,921
Outstanding Balance
$369,756
Interest Rate
3.87%
Mortgage Type
FHA
Estimated Equity
$323,696
Purchase Details
Closed on
Jul 31, 2015
Sold by
Peterson Laura Frazer
Bought by
Bird Ryan L
Home Financials for this Owner
Home Financials are based on the most recent Mortgage that was taken out on this home.
Original Mortgage
$403,750
Interest Rate
4.07%
Mortgage Type
Adjustable Rate Mortgage/ARM
Purchase Details
Closed on
Jun 28, 2010
Sold by
Appel Jeffrey S and Appel Angela C
Bought by
Peterson Laura Frazer
Home Financials for this Owner
Home Financials are based on the most recent Mortgage that was taken out on this home.
Original Mortgage
$212,000
Interest Rate
4.81%
Mortgage Type
New Conventional
Purchase Details
Closed on
Apr 15, 2004
Sold by
Shum Andrew C and Shum Lena K
Bought by
Appel Jeffrey S and Appel Angela C
Home Financials for this Owner
Home Financials are based on the most recent Mortgage that was taken out on this home.
Original Mortgage
$191,200
Interest Rate
3.75%
Mortgage Type
Unknown
Purchase Details
Closed on
Apr 21, 1999
Sold by
Barry Chapman Ross
Bought by
Shum Andrew C and Shum Lena K
Home Financials for this Owner
Home Financials are based on the most recent Mortgage that was taken out on this home.
Original Mortgage
$145,350
Interest Rate
7.16%
Purchase Details
Closed on
Mar 3, 1994
Sold by
Mcfadden Craig S and Mcfadden Janice G
Bought by
Chapman Ross Barry
Home Financials for this Owner
Home Financials are based on the most recent Mortgage that was taken out on this home.
Original Mortgage
$93,100
Interest Rate
6.75%
Purchase Details
Closed on
Feb 1, 1994
Sold by
Mcfadden Craig S and Mcnair Janice G
Bought by
Mcfadden Craig S and Mcfadden Janice G
Home Financials for this Owner
Home Financials are based on the most recent Mortgage that was taken out on this home.
Original Mortgage
$93,100
Interest Rate
6.75%
Purchase Details
Closed on
Dec 7, 1993
Sold by
Mcfadden Craig S and Mcnair Janice G
Bought by
Mcfadden Craig S and Mcfadden Janice G
Home Financials for this Owner
Home Financials are based on the most recent Mortgage that was taken out on this home.
Original Mortgage
$68,000
Interest Rate
7.1%
Create a Home Valuation Report for This Property
The Home Valuation Report is an in-depth analysis detailing your home's value as well as a comparison with similar homes in the area
Home Values in the Area
Average Home Value in this Area
Purchase History
| Date | Buyer | Sale Price | Title Company |
|---|---|---|---|
| Pudlik Danielle | $446,000 | None Available | |
| Bird Ryan L | $425,000 | Land Title Guarantee | |
| Peterson Laura Frazer | $265,000 | Land Title Guarantee Company | |
| Appel Jeffrey S | $239,000 | Guardian Title | |
| Shum Andrew C | $161,500 | First American | |
| Chapman Ross Barry | $98,000 | North American Title | |
| Mcfadden Craig S | -- | -- | |
| Mcfadden Craig S | $81,500 | -- | |
| Mcfadden Craig S | $81,500 | -- |
Source: Public Records
Mortgage History
| Date | Status | Borrower | Loan Amount |
|---|---|---|---|
| Open | Pudlik Danielle | $437,921 | |
| Previous Owner | Bird Ryan L | $403,750 | |
| Previous Owner | Peterson Laura Frazer | $212,000 | |
| Previous Owner | Appel Jeffrey S | $191,200 | |
| Previous Owner | Shum Andrew C | $145,350 | |
| Previous Owner | Chapman Ross Barry | $93,100 | |
| Previous Owner | Mcfadden Craig S | $68,000 | |
| Closed | Appel Jeffrey S | $47,800 |
Source: Public Records
Tax History Compared to Growth
Tax History
| Year | Tax Paid | Tax Assessment Tax Assessment Total Assessment is a certain percentage of the fair market value that is determined by local assessors to be the total taxable value of land and additions on the property. | Land | Improvement |
|---|---|---|---|---|
| 2024 | $3,034 | $38,310 | $25,610 | $12,700 |
| 2023 | $2,969 | $38,310 | $25,610 | $12,700 |
| 2022 | $2,609 | $32,810 | $29,300 | $3,510 |
| 2021 | $2,518 | $33,750 | $30,140 | $3,610 |
| 2020 | $2,621 | $35,330 | $27,910 | $7,420 |
| 2019 | $2,548 | $35,330 | $27,910 | $7,420 |
| 2018 | $2,402 | $31,050 | $19,120 | $11,930 |
| 2017 | $2,395 | $31,050 | $19,120 | $11,930 |
| 2016 | $2,154 | $26,420 | $19,892 | $6,528 |
| 2015 | $2,064 | $26,420 | $19,892 | $6,528 |
| 2014 | $1,863 | $22,430 | $14,917 | $7,513 |
Source: Public Records
Map
Nearby Homes
- 2350 S Ogden St
- 2544 S Lafayette St
- 2575 S Lafayette St
- 2554 S Lafayette St
- 2176 S Emerson St
- 2630 S Marion St Unit 2636
- 2630-2636 S Marion St
- 2161 S Downing St
- 2175 S Clarkson St
- 2475 S Gilpin St
- 2515 S Pennsylvania St Unit 2517
- 2420 S Gilpin St
- 2117 S Lafayette St
- 2140 S Washington St
- 2103 S Lafayette St
- 2137 S Washington St
- 2618 S Pennsylvania St
- 2443 S Williams St
- 2574 S Gilpin St
- 2434 S Williams St
- 2395 S Corona St
- 2373 S Corona St
- 2373 S Corona St Unit 2375
- 2375 S Corona St
- 1029 E Wesley Ave
- 2369 S Corona St
- 2380 S Corona St
- 2374 S Corona St
- 2363 S Corona St
- 2401 S Corona St Unit 2403
- 1111 E Wesley Ave
- 2368 S Corona St
- 1001 E Wesley Ave
- 2376 S Ogden St
- 2380 S Ogden St
- 2415 S Corona St
- 2400 S Corona St Unit 2402
- 2353 S Corona St
- 2360 S Corona St
- 2400 S Ogden St