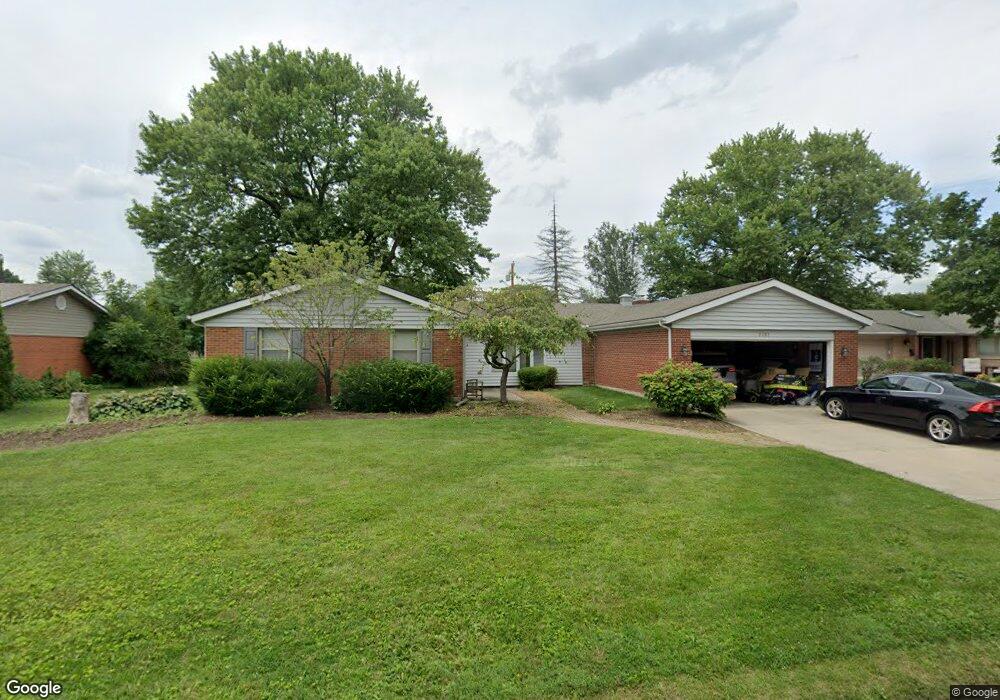
2385 Springmill Rd Dayton, OH 45440
Estimated Value: $312,008 - $350,000
3
Beds
2
Baths
2,050
Sq Ft
$165/Sq Ft
Est. Value
About This Home
This home is located at 2385 Springmill Rd, Dayton, OH 45440 and is currently estimated at $338,502, approximately $165 per square foot. 2385 Springmill Rd is a home located in Montgomery County with nearby schools including John F. Kennedy Elementary School, Kettering Middle School, and Kettering Fairmont High School.
Ownership History
Date
Name
Owned For
Owner Type
Purchase Details
Closed on
Aug 4, 2020
Sold by
Jk Real Estate Group Llc
Bought by
Beatty Jessica N and Loeb Eric J
Current Estimated Value
Home Financials for this Owner
Home Financials are based on the most recent Mortgage that was taken out on this home.
Original Mortgage
$245,373
Outstanding Balance
$217,663
Interest Rate
3%
Mortgage Type
FHA
Estimated Equity
$120,839
Purchase Details
Closed on
May 3, 2016
Sold by
Linron Investments Inc
Bought by
Jk Real Estate Group Llc
Purchase Details
Closed on
Nov 16, 2001
Sold by
Christian Mark A and Christian Aimee G
Bought by
Hilty Harold Lee and Hilty Kristin A
Home Financials for this Owner
Home Financials are based on the most recent Mortgage that was taken out on this home.
Original Mortgage
$137,837
Interest Rate
6.69%
Mortgage Type
FHA
Create a Home Valuation Report for This Property
The Home Valuation Report is an in-depth analysis detailing your home's value as well as a comparison with similar homes in the area
Home Values in the Area
Average Home Value in this Area
Purchase History
| Date | Buyer | Sale Price | Title Company |
|---|---|---|---|
| Beatty Jessica N | $249,900 | Fidelity Lawyers Ttl Agcy Ll | |
| Jk Real Estate Group Llc | $218,000 | None Available | |
| Hilty Harold Lee | $140,000 | -- |
Source: Public Records
Mortgage History
| Date | Status | Borrower | Loan Amount |
|---|---|---|---|
| Open | Beatty Jessica N | $245,373 | |
| Previous Owner | Hilty Harold Lee | $137,837 |
Source: Public Records
Tax History Compared to Growth
Tax History
| Year | Tax Paid | Tax Assessment Tax Assessment Total Assessment is a certain percentage of the fair market value that is determined by local assessors to be the total taxable value of land and additions on the property. | Land | Improvement |
|---|---|---|---|---|
| 2024 | $5,164 | $83,360 | $16,340 | $67,020 |
| 2023 | $5,164 | $83,360 | $16,340 | $67,020 |
| 2022 | $5,030 | $64,210 | $12,570 | $51,640 |
| 2021 | $4,756 | $64,210 | $12,570 | $51,640 |
| 2020 | $4,665 | $64,210 | $12,570 | $51,640 |
| 2019 | $6,270 | $74,720 | $12,570 | $62,150 |
| 2018 | $6,352 | $74,720 | $12,570 | $62,150 |
| 2017 | $5,818 | $74,720 | $12,570 | $62,150 |
| 2016 | $4,263 | $51,370 | $12,570 | $38,800 |
| 2015 | $4,658 | $51,370 | $12,570 | $38,800 |
| 2014 | $4,658 | $51,370 | $12,570 | $38,800 |
| 2012 | -- | $52,060 | $12,570 | $39,490 |
Source: Public Records
Map
Nearby Homes
- 2386 E Rahn Rd
- 2360 E Rahn Rd
- 5274 Millcreek Rd
- 2318 E Rahn Rd
- 2184 Broadbent Way
- 5052 Dobbs Dr
- 2169 Broadbent Way
- 5324 Oakbrooke Dr
- 2405 Westlawn Dr
- 5195 Bigger Rd
- 4824 Rean Meadow Dr
- 5335 Glendon Ln
- 2579 Walford Dr
- 2217 Westlawn Dr
- 2236 E Whipp Rd
- 4901 Wilmington Pike
- 5310 Glenmina Dr
- 5267 Newell Cir
- 2925 Walford Dr
- 2033 Westlawn Dr
- 2393 Springmill Rd
- 2377 Springmill Rd
- 2370 E Rahn Rd
- 2401 Springmill Rd
- 5200 Oakbrooke Dr
- 2369 Springmill Rd
- 2368 E Rahn Rd
- 2392 Springmill Rd
- 2400 Springmill Rd
- 2409 Springmill Rd
- 5212 Oakbrooke Dr
- 2394 E Rahn Rd
- 5211 Oakbrooke Dr
- 2336 Colony Way
- 2361 Springmill Rd
- 2417 Springmill Rd
- 2402 E Rahn Rd
- 5224 Oakbrooke Dr
- 5223 Oakbrooke Dr
- 2348 Colony Way