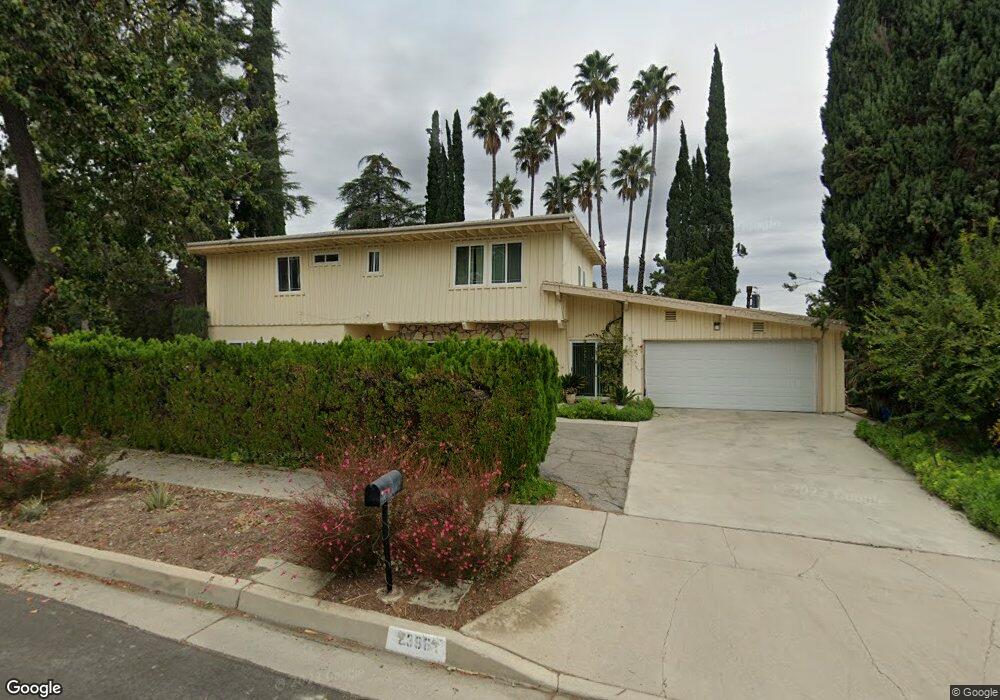
23861 Berdon St Woodland Hills, CA 91367
Estimated Value: $1,535,059 - $1,700,000
3
Beds
3
Baths
2,551
Sq Ft
$635/Sq Ft
Est. Value
About This Home
This home is located at 23861 Berdon St, Woodland Hills, CA 91367 and is currently estimated at $1,620,015, approximately $635 per square foot. 23861 Berdon St is a home located in Los Angeles County with nearby schools including Woodlake Elementary Community Charter, Lockhurst Drive Charter Elementary, and Haynes Charter For Enriched Studies.
Ownership History
Date
Name
Owned For
Owner Type
Purchase Details
Closed on
Jul 1, 2020
Sold by
Khanbabaian Arsen and Khanbabaian Satenik
Bought by
Khanbabaian Arsen and Khanbabaian Satenik
Current Estimated Value
Home Financials for this Owner
Home Financials are based on the most recent Mortgage that was taken out on this home.
Original Mortgage
$410,000
Outstanding Balance
$289,673
Interest Rate
3.1%
Mortgage Type
New Conventional
Estimated Equity
$1,330,342
Purchase Details
Closed on
Mar 26, 2007
Sold by
Khanbabaian Arsen and Khanbabaian Satenik
Bought by
Khanbabaian Arsen and Khanbabaian Satenik
Purchase Details
Closed on
Sep 3, 1996
Sold by
Berkeley Federal Bank & Trust Fsb
Bought by
Khanbabaian Arsen and Khanbabaian Satenik
Purchase Details
Closed on
Apr 24, 1995
Sold by
Winbush Wilbert B and Western Fsla
Bought by
Berkeley Federal Bank & Trust Fsb
Create a Home Valuation Report for This Property
The Home Valuation Report is an in-depth analysis detailing your home's value as well as a comparison with similar homes in the area
Home Values in the Area
Average Home Value in this Area
Purchase History
| Date | Buyer | Sale Price | Title Company |
|---|---|---|---|
| Khanbabaian Arsen | -- | Accommodation | |
| Khanbabaian Arsen | -- | Priority Title | |
| Khanbabaian Arsen | -- | None Available | |
| Khanbabaian Arsen | $235,500 | Chicago Title Co | |
| Berkeley Federal Bank & Trust Fsb | $216,340 | World Title Company |
Source: Public Records
Mortgage History
| Date | Status | Borrower | Loan Amount |
|---|---|---|---|
| Open | Khanbabaian Arsen | $410,000 |
Source: Public Records
Tax History Compared to Growth
Tax History
| Year | Tax Paid | Tax Assessment Tax Assessment Total Assessment is a certain percentage of the fair market value that is determined by local assessors to be the total taxable value of land and additions on the property. | Land | Improvement |
|---|---|---|---|---|
| 2025 | $4,972 | $383,530 | $195,429 | $188,101 |
| 2024 | $4,972 | $376,011 | $191,598 | $184,413 |
| 2023 | $4,883 | $368,640 | $187,842 | $180,798 |
| 2022 | $4,669 | $361,412 | $184,159 | $177,253 |
| 2021 | $4,601 | $354,327 | $180,549 | $173,778 |
| 2019 | $4,470 | $343,820 | $175,195 | $168,625 |
| 2018 | $4,356 | $337,079 | $171,760 | $165,319 |
| 2016 | $4,144 | $323,992 | $165,092 | $158,900 |
| 2015 | $4,087 | $319,127 | $162,613 | $156,514 |
| 2014 | $4,109 | $312,877 | $159,428 | $153,449 |
Source: Public Records
Map
Nearby Homes
- 5320 Orrville Ave
- 5534 Pattilar Ave
- 23701 Clarendon St
- 23721 Mariano St
- 23717 Crosson Dr
- 5630 Blanco Ave
- 5700 El Canon Ave
- 23853 Hatteras St
- 5329 Blanco Ave
- 5622 Le Sage Ave
- 5540 Franrivers Ave
- 5547 Paradise Valley Rd
- 5357 Ellenvale Ave
- 5546 Paradise Valley Rd
- 23623 Ladrillo St
- 23761 Ladrillo St
- 23952 Nomar St
- 23442 Burbank Blvd
- 5831 Elba Place
- 24172 Lupin Hill Rd
- 23851 Berdon St
- 23860 Burbank Blvd
- 23868 Burbank Blvd
- 23850 Burbank Blvd
- 23864 Berdon St
- 23854 Berdon St
- 23841 Berdon St
- 5533 El Canon Ave
- 5527 El Canon Ave
- 5521 El Canon Ave
- 23842 Berdon St
- 23838 Burbank Blvd
- 5539 El Canon Ave
- 23837 Killion St
- 23825 Killion St
- 23831 Berdon St
- 23849 Killion St
- 23830 Berdon St
- 5547 El Canon Ave
- 23826 Burbank Blvd