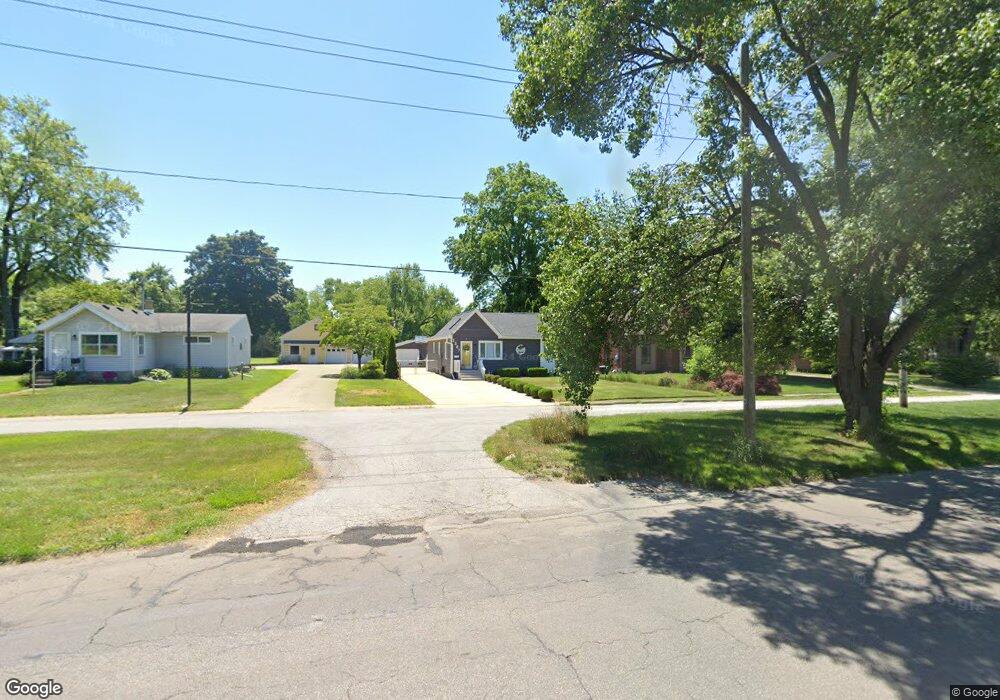
2387 Tremainsville Rd Toledo, OH 43613
DeVeaux NeighborhoodEstimated Value: $181,000 - $239,000
3
Beds
2
Baths
1,544
Sq Ft
$139/Sq Ft
Est. Value
About This Home
This home is located at 2387 Tremainsville Rd, Toledo, OH 43613 and is currently estimated at $214,107, approximately $138 per square foot. 2387 Tremainsville Rd is a home located in Lucas County with nearby schools including Jefferson Junior High School, Washington Junior High School, and Whitmer High School.
Ownership History
Date
Name
Owned For
Owner Type
Purchase Details
Closed on
Mar 11, 2003
Sold by
Carr Tina M
Bought by
Davis Talaya D
Current Estimated Value
Home Financials for this Owner
Home Financials are based on the most recent Mortgage that was taken out on this home.
Original Mortgage
$129,000
Outstanding Balance
$59,441
Interest Rate
6.87%
Mortgage Type
New Conventional
Estimated Equity
$154,666
Purchase Details
Closed on
Mar 7, 2003
Sold by
Carr Tina M
Bought by
Davis Talaya D
Home Financials for this Owner
Home Financials are based on the most recent Mortgage that was taken out on this home.
Original Mortgage
$129,000
Outstanding Balance
$59,441
Interest Rate
6.87%
Mortgage Type
New Conventional
Estimated Equity
$154,666
Purchase Details
Closed on
Oct 1, 2002
Sold by
Carr William D
Bought by
Carr Tina M
Create a Home Valuation Report for This Property
The Home Valuation Report is an in-depth analysis detailing your home's value as well as a comparison with similar homes in the area
Home Values in the Area
Average Home Value in this Area
Purchase History
| Date | Buyer | Sale Price | Title Company |
|---|---|---|---|
| Davis Talaya D | $129,000 | -- | |
| Davis Talaya D | $129,000 | Midland | |
| Carr Tina M | -- | -- |
Source: Public Records
Mortgage History
| Date | Status | Borrower | Loan Amount |
|---|---|---|---|
| Open | Davis Talaya D | $129,000 | |
| Closed | Davis Talaya D | $129,000 |
Source: Public Records
Tax History Compared to Growth
Tax History
| Year | Tax Paid | Tax Assessment Tax Assessment Total Assessment is a certain percentage of the fair market value that is determined by local assessors to be the total taxable value of land and additions on the property. | Land | Improvement |
|---|---|---|---|---|
| 2024 | $1,431 | $46,760 | $13,475 | $33,285 |
| 2023 | $2,821 | $39,410 | $11,690 | $27,720 |
| 2022 | $2,804 | $39,410 | $11,690 | $27,720 |
| 2021 | $2,882 | $39,410 | $11,690 | $27,720 |
| 2020 | $2,990 | $35,315 | $14,665 | $20,650 |
| 2019 | $2,895 | $35,315 | $14,665 | $20,650 |
| 2018 | $2,698 | $35,315 | $14,665 | $20,650 |
| 2017 | $4,174 | $34,510 | $14,315 | $20,195 |
| 2016 | $2,734 | $98,600 | $40,900 | $57,700 |
| 2015 | $2,748 | $98,600 | $40,900 | $57,700 |
| 2014 | $3,531 | $34,520 | $14,320 | $20,200 |
| 2013 | $2,354 | $34,520 | $14,320 | $20,200 |
Source: Public Records
Map
Nearby Homes
- 2344 Mellwood Ave
- 2310 Tremainsville Rd
- 2285 Fitkin St
- 4924 Roywood Rd
- 2605 Wyndale Rd
- 2224 Olin Dr
- 2408 Lambert Dr
- 2623 W Laskey Rd
- 2433 Paradise Ave
- 2409 Lambert Dr
- 2341 Wernert Ave
- 2316 Westbrook Dr
- 5211 Douglas Rd
- 2820 Claredale Rd
- 2149 Westbrook Dr
- 2728 Castleton Ave
- 4440 Woodmont Rd
- 2640 Westbrook Dr
- 2513 Grantwood Dr
- 2624 Grantwood Dr
- 2401 Tremainsville Rd
- 2385 Tremainsville Rd
- 2407 Tremainsville Rd
- 2379 Tremainsville Rd
- 2433 Tremainsville Rd
- 2373 Tremainsville Rd
- 2410 Tremainsville Rd
- 2435 Tremainsville Rd
- 2367 Tremainsville Rd
- 2394 Tremainsville Rd
- 2388 Tremainsville Rd
- 2380 Tremainsville Rd
- 2439 Tremainsville Rd
- 2402 Tremainsville Rd
- 2374 Tremainsville Rd
- 2368 Tremainsville Rd
- 2355 Tremainsville Rd
- 2356 Tremainsville Rd
- 2354 Tremainsville Rd
- 4812 Douglas Rd