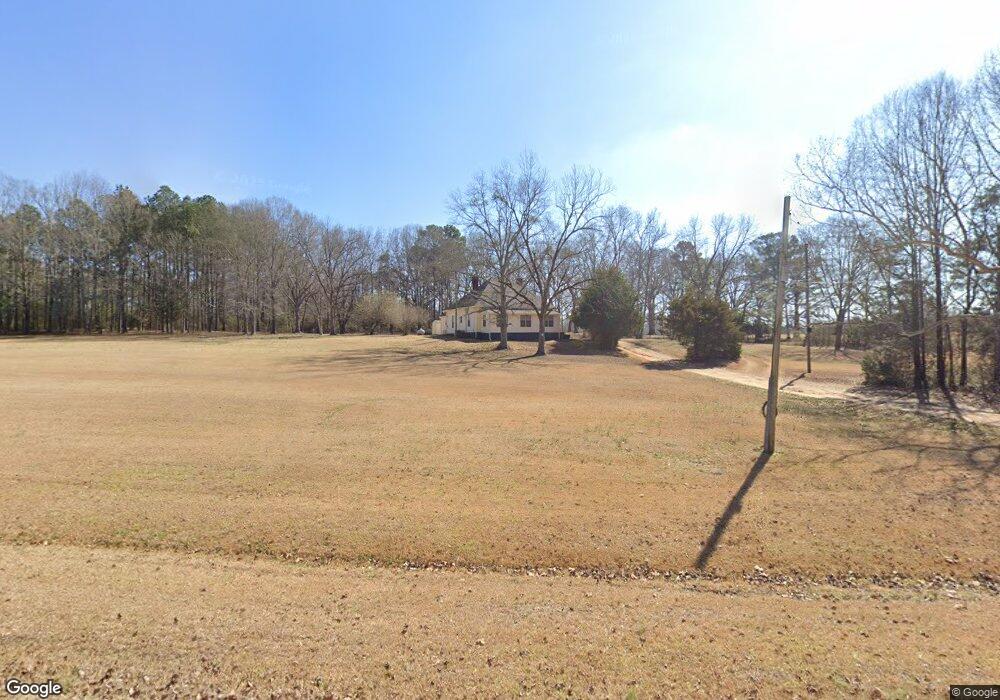
2388 Shackelford Rd Griffin, GA 30224
Estimated Value: $245,000 - $377,000
3
Beds
2
Baths
1,878
Sq Ft
$164/Sq Ft
Est. Value
About This Home
This home is located at 2388 Shackelford Rd, Griffin, GA 30224 and is currently estimated at $307,955, approximately $163 per square foot. 2388 Shackelford Rd is a home located in Pike County with nearby schools including Pike County Primary School, Pike County Elementary School, and Pike County Middle School.
Ownership History
Date
Name
Owned For
Owner Type
Purchase Details
Closed on
Sep 10, 2020
Sold by
Howell Griffin E
Bought by
Smith Billy Michael and Shoemaker Danielle Nichole
Current Estimated Value
Home Financials for this Owner
Home Financials are based on the most recent Mortgage that was taken out on this home.
Original Mortgage
$147,184
Outstanding Balance
$130,616
Interest Rate
2.9%
Mortgage Type
FHA
Estimated Equity
$177,339
Purchase Details
Closed on
Nov 2, 2004
Sold by
Hall Zenab and Hall Richard
Bought by
Hall Richard and Hall Zenab
Purchase Details
Closed on
Apr 16, 2004
Sold by
Hall Zenab
Bought by
Hall Zenab and Hall Richard
Purchase Details
Closed on
Nov 13, 1995
Sold by
Holcomb Arthur and Holcomb Shirley
Bought by
Hall Zenab
Purchase Details
Closed on
Feb 24, 1987
Sold by
Holcomb Arthur Lee
Bought by
Holcomb Arthur and Holcomb Shirley
Purchase Details
Closed on
May 29, 1975
Sold by
Chambley Ellen B
Bought by
Holcomb Arthur Lee
Create a Home Valuation Report for This Property
The Home Valuation Report is an in-depth analysis detailing your home's value as well as a comparison with similar homes in the area
Home Values in the Area
Average Home Value in this Area
Purchase History
| Date | Buyer | Sale Price | Title Company |
|---|---|---|---|
| Smith Billy Michael | $149,900 | -- | |
| Hall Richard | -- | -- | |
| Hall Zenab | -- | -- | |
| Hall Zenab | $42,000 | -- | |
| Holcomb Arthur | -- | -- | |
| Holcomb Arthur Lee | -- | -- |
Source: Public Records
Mortgage History
| Date | Status | Borrower | Loan Amount |
|---|---|---|---|
| Open | Smith Billy Michael | $147,184 |
Source: Public Records
Tax History Compared to Growth
Tax History
| Year | Tax Paid | Tax Assessment Tax Assessment Total Assessment is a certain percentage of the fair market value that is determined by local assessors to be the total taxable value of land and additions on the property. | Land | Improvement |
|---|---|---|---|---|
| 2024 | $1,709 | $68,957 | $19,181 | $49,776 |
| 2023 | $2,001 | $68,957 | $19,181 | $49,776 |
| 2022 | $1,527 | $52,637 | $19,181 | $33,456 |
| 2021 | $1,357 | $45,196 | $11,740 | $33,456 |
| 2020 | $1,298 | $44,652 | $11,740 | $32,912 |
| 2019 | $1,164 | $35,608 | $11,740 | $23,868 |
| 2018 | $1,165 | $35,608 | $11,740 | $23,868 |
| 2017 | $972 | $35,608 | $11,740 | $23,868 |
| 2016 | $1,072 | $35,608 | $11,740 | $23,868 |
| 2015 | $1,020 | $35,608 | $11,740 | $23,868 |
| 2014 | $1,035 | $35,608 | $11,740 | $23,868 |
| 2013 | -- | $35,608 | $11,740 | $23,868 |
Source: Public Records
Map
Nearby Homes
- 1605 Shackelford Rd
- 0 Oak Grove Trial
- 21 Oak Grove Trail
- 142 Williams Trail
- 616 Shackelford Rd
- 1200 White Oak Way
- 490 County Line Rd
- 1215 White Oak Way
- 420 County Line Rd
- 1117 Birchwood Dr
- 534 Deer Lake Dr
- 116 Southbrook Dr
- 15046 U S 19
- 15390 U S Highway 19 Hwy
- 138 Townsend Ct
- 119 Townsend Ct
- 135 Townsend Ct
- 1317 Sycamore Cir
- 137 Townsend Dr
- 219 Timber Wolf Trail
- 138 Meadow Lark Rd
- 2504 Shackelford Rd
- 2481 Shackelford Rd
- 0 Meadow Lark Rd Unit 7574067
- 0 Meadow Lark Rd
- 141 Meadow Lark Rd
- 32 Meadow Lark Rd
- 99 Meadow Lark Rd
- 67 Meadow Lark Rd
- 2551 Shackelford Rd
- 1632 Hemphill Rd
- 33 Meadow Lark Rd
- 1660 Hemphill Rd
- 2615 Shackelford Rd
- 2648 Shackelford Rd
- 1658 Hemphill Rd
- 2689 Shackelford Rd
- 2668 Shackelford Rd
- 1901 Hemphill Rd
- 1570 Hemphill Rd