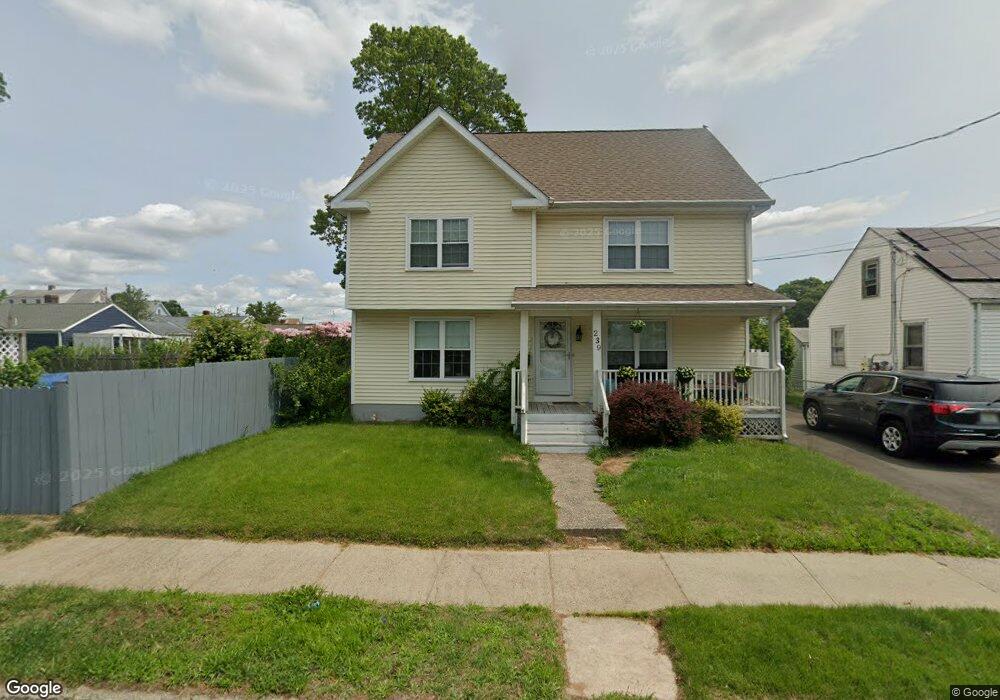
239 3rd Ave West Haven, CT 06516
West Haven Center NeighborhoodEstimated Value: $388,000 - $458,000
3
Beds
2
Baths
1,748
Sq Ft
$242/Sq Ft
Est. Value
About This Home
This home is located at 239 3rd Ave, West Haven, CT 06516 and is currently estimated at $423,327, approximately $242 per square foot. 239 3rd Ave is a home located in New Haven County with nearby schools including Carrigan 5/6 Intermediate School, Harry M. Bailey Middle School, and West Haven High School.
Ownership History
Date
Name
Owned For
Owner Type
Purchase Details
Closed on
Jan 27, 2006
Sold by
Choronzy Barbara and Marra Peter V
Bought by
Mattiello Michael J and Mattiello Amy R
Current Estimated Value
Purchase Details
Closed on
Apr 6, 2004
Sold by
Marra Richard M
Bought by
Choronzy Barbara and Marra Peter V
Create a Home Valuation Report for This Property
The Home Valuation Report is an in-depth analysis detailing your home's value as well as a comparison with similar homes in the area
Home Values in the Area
Average Home Value in this Area
Purchase History
| Date | Buyer | Sale Price | Title Company |
|---|---|---|---|
| Mattiello Michael J | $120,000 | -- | |
| Choronzy Barbara | $40,000 | -- | |
| Mattiello Michael J | $120,000 | -- | |
| Choronzy Barbara | $40,000 | -- |
Source: Public Records
Mortgage History
| Date | Status | Borrower | Loan Amount |
|---|---|---|---|
| Open | Choronzy Barbara | $100,000 | |
| Closed | Choronzy Barbara | $176,000 |
Source: Public Records
Tax History
| Year | Tax Paid | Tax Assessment Tax Assessment Total Assessment is a certain percentage of the fair market value that is determined by local assessors to be the total taxable value of land and additions on the property. | Land | Improvement |
|---|---|---|---|---|
| 2025 | $9,279 | $268,730 | $59,780 | $208,950 |
| 2024 | $9,242 | $190,470 | $41,370 | $149,100 |
| 2023 | $8,859 | $190,470 | $41,370 | $149,100 |
| 2022 | $8,685 | $190,470 | $41,370 | $149,100 |
| 2021 | $8,685 | $190,470 | $41,370 | $149,100 |
| 2020 | $8,334 | $165,130 | $33,320 | $131,810 |
| 2019 | $8,037 | $165,130 | $33,320 | $131,810 |
| 2018 | $7,968 | $165,130 | $33,320 | $131,810 |
| 2017 | $7,540 | $165,130 | $33,320 | $131,810 |
| 2016 | $7,523 | $165,130 | $33,320 | $131,810 |
| 2015 | $6,827 | $169,190 | $37,100 | $132,090 |
| 2014 | $6,785 | $169,190 | $37,100 | $132,090 |
Source: Public Records
Map
Nearby Homes
Your Personal Tour Guide
Ask me questions while you tour the home.