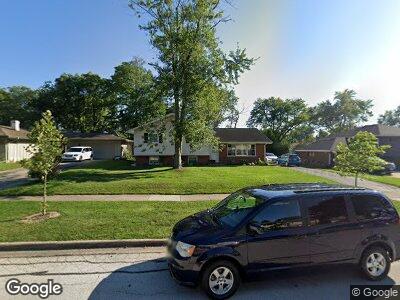
239 55th Place Downers Grove, IL 60516
Estimated Value: $424,000 - $463,852
--
Bed
1
Bath
1,396
Sq Ft
$316/Sq Ft
Est. Value
About This Home
This home is located at 239 55th Place, Downers Grove, IL 60516 and is currently estimated at $441,213, approximately $316 per square foot. 239 55th Place is a home located in DuPage County with nearby schools including Fairmount Elementary School, O'Neill Middle School, and Downers Grove South High School.
Ownership History
Date
Name
Owned For
Owner Type
Purchase Details
Closed on
Sep 13, 2021
Sold by
Bodmer Edward C and Doris E Bodmer Declaration Of
Bought by
Dela Sancha Diana and De La Sancha
Current Estimated Value
Home Financials for this Owner
Home Financials are based on the most recent Mortgage that was taken out on this home.
Original Mortgage
$338,045
Outstanding Balance
$317,459
Interest Rate
3.37%
Mortgage Type
New Conventional
Estimated Equity
$136,233
Purchase Details
Closed on
May 12, 1994
Sold by
Bodmer Arnold R and Bodmer Doris E
Bought by
Bodmer Doris E
Create a Home Valuation Report for This Property
The Home Valuation Report is an in-depth analysis detailing your home's value as well as a comparison with similar homes in the area
Home Values in the Area
Average Home Value in this Area
Purchase History
| Date | Buyer | Sale Price | Title Company |
|---|---|---|---|
| Dela Sancha Diana | $348,500 | Proper Title Llc | |
| Bodmer Doris E | -- | -- | |
| Bodmer Arnold R | -- | -- |
Source: Public Records
Mortgage History
| Date | Status | Borrower | Loan Amount |
|---|---|---|---|
| Open | Dela Sancha Diana | $338,045 |
Source: Public Records
Tax History Compared to Growth
Tax History
| Year | Tax Paid | Tax Assessment Tax Assessment Total Assessment is a certain percentage of the fair market value that is determined by local assessors to be the total taxable value of land and additions on the property. | Land | Improvement |
|---|---|---|---|---|
| 2023 | $5,867 | $106,700 | $63,060 | $43,640 |
| 2022 | $5,681 | $102,520 | $60,590 | $41,930 |
| 2021 | $5,315 | $101,350 | $59,900 | $41,450 |
| 2020 | $5,215 | $99,340 | $58,710 | $40,630 |
| 2019 | $5,044 | $95,310 | $56,330 | $38,980 |
| 2018 | $4,980 | $93,140 | $56,040 | $37,100 |
| 2017 | $4,475 | $83,680 | $53,930 | $29,750 |
| 2016 | $4,380 | $79,860 | $51,470 | $28,390 |
| 2015 | $4,324 | $75,130 | $48,420 | $26,710 |
| 2014 | $4,322 | $73,050 | $47,080 | $25,970 |
| 2013 | $4,234 | $72,710 | $46,860 | $25,850 |
Source: Public Records
Map
Nearby Homes