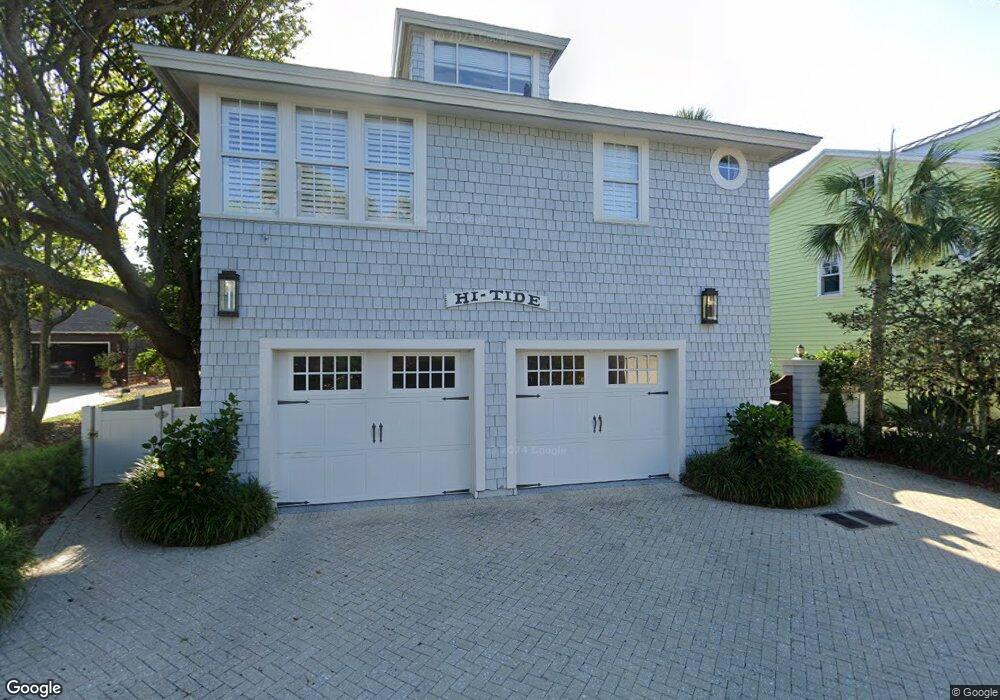
239 Beach Ave Atlantic Beach, FL 32233
Estimated Value: $3,468,000 - $4,702,000
5
Beds
6
Baths
5,090
Sq Ft
$831/Sq Ft
Est. Value
About This Home
This home is located at 239 Beach Ave, Atlantic Beach, FL 32233 and is currently estimated at $4,229,549, approximately $830 per square foot. 239 Beach Ave is a home located in Duval County with nearby schools including Atlantic Beach Elementary School, Mayport Middle School, and Duncan U. Fletcher High School.
Ownership History
Date
Name
Owned For
Owner Type
Purchase Details
Closed on
Mar 31, 2004
Sold by
Santayana George and Santayana Ann T
Bought by
Hyman Charles D and Healy Janet S
Current Estimated Value
Home Financials for this Owner
Home Financials are based on the most recent Mortgage that was taken out on this home.
Original Mortgage
$800,000
Outstanding Balance
$364,760
Interest Rate
5.54%
Mortgage Type
Purchase Money Mortgage
Estimated Equity
$3,864,789
Purchase Details
Closed on
Nov 19, 1997
Sold by
Santayana George and Santayana Ann T
Bought by
Santayana Ann T and Santayana George
Create a Home Valuation Report for This Property
The Home Valuation Report is an in-depth analysis detailing your home's value as well as a comparison with similar homes in the area
Home Values in the Area
Average Home Value in this Area
Purchase History
| Date | Buyer | Sale Price | Title Company |
|---|---|---|---|
| Hyman Charles D | -- | -- | |
| Hyman Charles D | $2,500,000 | -- | |
| Santayana Ann T | $100 | -- |
Source: Public Records
Mortgage History
| Date | Status | Borrower | Loan Amount |
|---|---|---|---|
| Open | Hyman Charles D | $800,000 | |
| Closed | Hyman Charles D | $800,000 |
Source: Public Records
Tax History
| Year | Tax Paid | Tax Assessment Tax Assessment Total Assessment is a certain percentage of the fair market value that is determined by local assessors to be the total taxable value of land and additions on the property. | Land | Improvement |
|---|---|---|---|---|
| 2026 | $35,922 | $2,135,319 | -- | -- |
| 2025 | $35,006 | $2,108,739 | -- | -- |
| 2024 | $33,974 | $2,058,147 | -- | -- |
| 2023 | $33,974 | $2,000,174 | $0 | $0 |
| 2022 | $31,301 | $1,904,465 | $0 | $0 |
| 2021 | $31,173 | $1,829,257 | $0 | $0 |
| 2020 | $30,825 | $1,798,484 | $0 | $0 |
| 2019 | $30,621 | $1,761,353 | $0 | $0 |
| 2018 | $30,424 | $1,735,152 | $0 | $0 |
| 2017 | $30,215 | $1,706,395 | $0 | $0 |
| 2016 | $29,893 | $1,662,329 | $0 | $0 |
| 2015 | $30,008 | $1,625,714 | $0 | $0 |
| 2014 | $29,877 | $1,601,796 | $0 | $0 |
Source: Public Records
Map
Nearby Homes
Your Personal Tour Guide
Ask me questions while you tour the home.