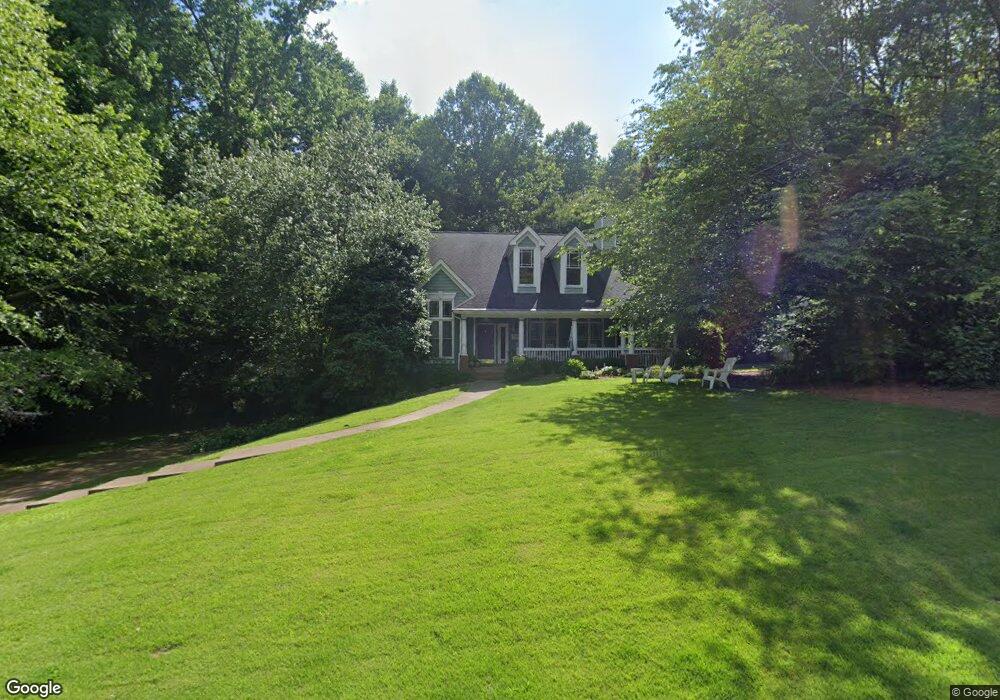
239 Birch Bend Dr Alpharetta, GA 30004
Union Hill NeighborhoodEstimated Value: $739,716 - $758,000
4
Beds
4
Baths
3,666
Sq Ft
$204/Sq Ft
Est. Value
About This Home
This home is located at 239 Birch Bend Dr, Alpharetta, GA 30004 and is currently estimated at $748,858, approximately $204 per square foot. 239 Birch Bend Dr is a home located in Cherokee County with nearby schools including Free Home Elementary School, Creekland Middle School, and Creekview High School.
Ownership History
Date
Name
Owned For
Owner Type
Purchase Details
Closed on
Sep 14, 2023
Sold by
Baldwin Julie
Bought by
Garofano Gabriel and Garofano Karen A
Current Estimated Value
Purchase Details
Closed on
Oct 28, 2011
Sold by
Lollis Lorenzo
Bought by
Romanofsky-Loll Sandra
Purchase Details
Closed on
Jul 31, 2006
Sold by
Riordan James J Living Trust
Bought by
Lollis Lorenzo and Romanofsky-Lollis Sandra
Home Financials for this Owner
Home Financials are based on the most recent Mortgage that was taken out on this home.
Original Mortgage
$200,000
Interest Rate
6.67%
Mortgage Type
New Conventional
Create a Home Valuation Report for This Property
The Home Valuation Report is an in-depth analysis detailing your home's value as well as a comparison with similar homes in the area
Home Values in the Area
Average Home Value in this Area
Purchase History
| Date | Buyer | Sale Price | Title Company |
|---|---|---|---|
| Garofano Gabriel | $719,000 | -- | |
| Romanofsky-Loll Sandra | $320,000 | -- | |
| Lollis Lorenzo | $320,000 | -- |
Source: Public Records
Mortgage History
| Date | Status | Borrower | Loan Amount |
|---|---|---|---|
| Previous Owner | Lollis Lorenzo | $200,000 |
Source: Public Records
Tax History Compared to Growth
Tax History
| Year | Tax Paid | Tax Assessment Tax Assessment Total Assessment is a certain percentage of the fair market value that is determined by local assessors to be the total taxable value of land and additions on the property. | Land | Improvement |
|---|---|---|---|---|
| 2025 | $1,181 | $202,904 | $50,000 | $152,904 |
| 2024 | $1,277 | $207,048 | $50,000 | $157,048 |
| 2023 | $916 | $173,556 | $28,000 | $145,556 |
| 2022 | $1,025 | $150,200 | $28,000 | $122,200 |
| 2021 | $1,063 | $138,480 | $28,000 | $110,480 |
| 2020 | $1,016 | $125,080 | $22,800 | $102,280 |
| 2019 | $1,032 | $129,400 | $22,800 | $106,600 |
| 2018 | $1,020 | $121,240 | $22,800 | $98,440 |
| 2017 | $1,033 | $294,700 | $22,800 | $95,080 |
| 2016 | $1,046 | $282,500 | $22,800 | $90,200 |
| 2015 | $927 | $241,200 | $19,200 | $77,280 |
| 2014 | $925 | $240,700 | $16,000 | $80,280 |
Source: Public Records
Map
Nearby Homes
- 212 Silver Birch Ct
- 4465 Mossbrook Cir
- 7880 Brands Hatch Blvd
- 2687 Holbrook Campground Rd
- 2675 Holbrook Campground Rd
- 7825 Brands Hatch Blvd
- 4645 Hamptons Dr
- 5385 Drew Rd
- 4415 Indian Trace Dr
- 7619 Campground Rd
- 4655 Hamptons Dr
- 412 Manor Ridge View
- 4750 Hamptons Dr
- 116 Waverly Dr
- 6645 Bentley Ridge Dr
- 6610 Tything Ct
- 7380 Bates Dr
- 490 Lummus Rd
- 249 Birch Bend Dr
- 269 Birch Bend Dr
- 250 Birch Bend Dr
- 229 Birch Bend Dr
- 204 Silver Birch Ct
- 270 Birch Bend Dr Unit III
- 0 Birch Bend Dr Unit 7454882
- 0 Birch Bend Dr Unit 7173792
- 0 Birch Bend Dr Unit 8664083
- 0 Birch Bend Dr Unit 8168159
- 0 Birch Bend Dr Unit 8322264
- 0 Birch Bend Dr Unit 3229634
- 0 Birch Bend Dr Unit 8045772
- 0 Birch Bend Dr
- 925 Birch Bend Dr
- 289 Birch Bend Dr
- 207 Silver Birch Ct
- 230 Birch Bend Dr
- 219 Birch Bend Dr
- 211 Silver Birch Ct Unit III