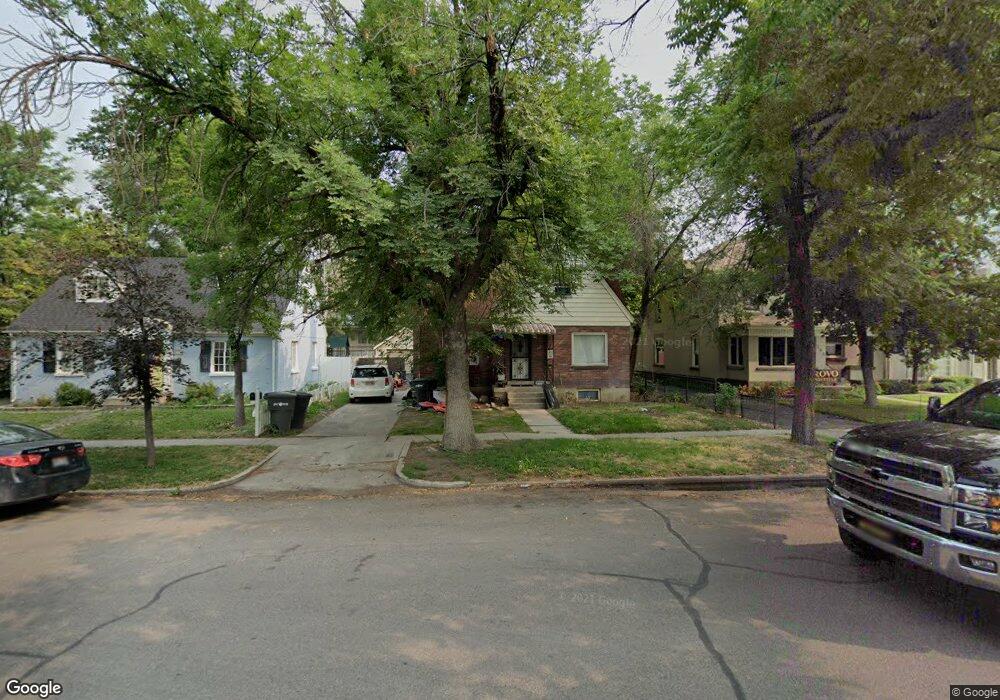
239 E 100 S Provo, UT 84606
Joaquin NeighborhoodEstimated Value: $433,000 - $526,000
5
Beds
2
Baths
1,291
Sq Ft
$367/Sq Ft
Est. Value
About This Home
This home is located at 239 E 100 S, Provo, UT 84606 and is currently estimated at $473,352, approximately $366 per square foot. 239 E 100 S is a home located in Utah County with nearby schools including Provo Peaks School, Centennial Middle School, and Timpview High School.
Ownership History
Date
Name
Owned For
Owner Type
Purchase Details
Closed on
Dec 7, 2009
Sold by
Knight Glen P
Bought by
Knight Glen P
Current Estimated Value
Home Financials for this Owner
Home Financials are based on the most recent Mortgage that was taken out on this home.
Original Mortgage
$123,750
Interest Rate
5.01%
Mortgage Type
New Conventional
Purchase Details
Closed on
Jun 4, 2001
Sold by
Knight Kaye
Bought by
Knight Glen P
Home Financials for this Owner
Home Financials are based on the most recent Mortgage that was taken out on this home.
Original Mortgage
$96,500
Interest Rate
7.15%
Create a Home Valuation Report for This Property
The Home Valuation Report is an in-depth analysis detailing your home's value as well as a comparison with similar homes in the area
Home Values in the Area
Average Home Value in this Area
Purchase History
| Date | Buyer | Sale Price | Title Company |
|---|---|---|---|
| Knight Glen P | -- | Wasatch Title Insurance Age | |
| Knight Glen P | -- | Title West Title Co |
Source: Public Records
Mortgage History
| Date | Status | Borrower | Loan Amount |
|---|---|---|---|
| Closed | Knight Glen P | $123,750 | |
| Closed | Knight Glen P | $96,500 |
Source: Public Records
Tax History Compared to Growth
Tax History
| Year | Tax Paid | Tax Assessment Tax Assessment Total Assessment is a certain percentage of the fair market value that is determined by local assessors to be the total taxable value of land and additions on the property. | Land | Improvement |
|---|---|---|---|---|
| 2025 | $2,117 | $219,120 | -- | -- |
| 2024 | $2,117 | $378,800 | $0 | $0 |
| 2023 | $2,156 | $209,220 | $0 | $0 |
| 2022 | $3,891 | $380,700 | $187,700 | $193,000 |
| 2021 | $1,582 | $269,900 | $110,400 | $159,500 |
| 2020 | $1,526 | $244,100 | $100,400 | $143,700 |
| 2019 | $1,456 | $242,300 | $100,400 | $141,900 |
| 2018 | $1,289 | $217,500 | $94,100 | $123,400 |
| 2017 | $1,195 | $110,825 | $0 | $0 |
| 2016 | $1,147 | $99,165 | $0 | $0 |
| 2015 | $1,103 | $96,360 | $0 | $0 |
| 2014 | $988 | $89,980 | $0 | $0 |
Source: Public Records
Map
Nearby Homes