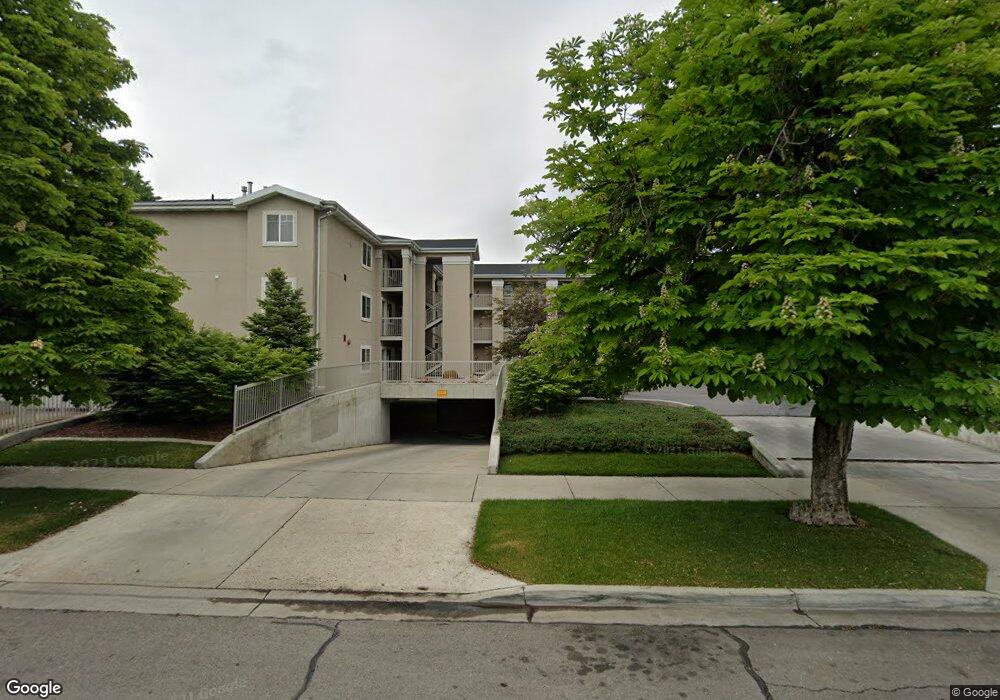
239 E 300 N Provo, UT 84606
Joaquin NeighborhoodEstimated Value: $423,000 - $535,000
4
Beds
2
Baths
1,164
Sq Ft
$403/Sq Ft
Est. Value
About This Home
This home is located at 239 E 300 N, Provo, UT 84606 and is currently estimated at $469,223, approximately $403 per square foot. 239 E 300 N is a home located in Utah County with nearby schools including Provo Peaks School, Centennial Middle School, and Timpview High School.
Ownership History
Date
Name
Owned For
Owner Type
Purchase Details
Closed on
Dec 17, 2021
Sold by
300 North 203 Llc
Bought by
Berrett Nathan R
Current Estimated Value
Home Financials for this Owner
Home Financials are based on the most recent Mortgage that was taken out on this home.
Original Mortgage
$281,250
Outstanding Balance
$220,081
Interest Rate
2.39%
Mortgage Type
New Conventional
Estimated Equity
$249,142
Purchase Details
Closed on
Aug 10, 2017
Sold by
Bennett Carol S
Bought by
300 North 203 Llc
Purchase Details
Closed on
Sep 30, 2008
Sold by
Durrant Llc
Bought by
Bennett Carol S and Bennett Charles R
Purchase Details
Closed on
Jun 21, 2002
Sold by
Durrant Llc
Bought by
Hunter Richard
Home Financials for this Owner
Home Financials are based on the most recent Mortgage that was taken out on this home.
Original Mortgage
$104,650
Interest Rate
6.86%
Create a Home Valuation Report for This Property
The Home Valuation Report is an in-depth analysis detailing your home's value as well as a comparison with similar homes in the area
Home Values in the Area
Average Home Value in this Area
Purchase History
| Date | Buyer | Sale Price | Title Company |
|---|---|---|---|
| Berrett Nathan R | -- | Investors Title | |
| 300 North 203 Llc | -- | None Available | |
| Bennett Carol S | -- | None Available | |
| Bennett Carol S | -- | Signature Title Insurance A | |
| Hunter Richard | -- | First American Title Co |
Source: Public Records
Mortgage History
| Date | Status | Borrower | Loan Amount |
|---|---|---|---|
| Open | Berrett Nathan R | $281,250 | |
| Previous Owner | Hunter Richard | $104,650 |
Source: Public Records
Tax History
| Year | Tax Paid | Tax Assessment Tax Assessment Total Assessment is a certain percentage of the fair market value that is determined by local assessors to be the total taxable value of land and additions on the property. | Land | Improvement |
|---|---|---|---|---|
| 2025 | $2,156 | $228,855 | -- | -- |
| 2024 | $2,156 | $212,190 | $0 | $0 |
| 2023 | $2,150 | $208,615 | $0 | $0 |
| 2022 | $2,141 | $209,495 | $0 | $0 |
| 2021 | $1,800 | $307,200 | $36,900 | $270,300 |
| 2020 | $1,775 | $284,000 | $34,100 | $249,900 |
| 2019 | $1,545 | $257,000 | $30,000 | $227,000 |
| 2018 | $1,410 | $238,000 | $30,000 | $208,000 |
| 2017 | $1,305 | $121,000 | $0 | $0 |
| 2016 | $1,273 | $110,000 | $0 | $0 |
| 2015 | $1,259 | $110,000 | $0 | $0 |
| 2014 | $1,208 | $110,000 | $0 | $0 |
Source: Public Records
Map
Nearby Homes
Your Personal Tour Guide
Ask me questions while you tour the home.