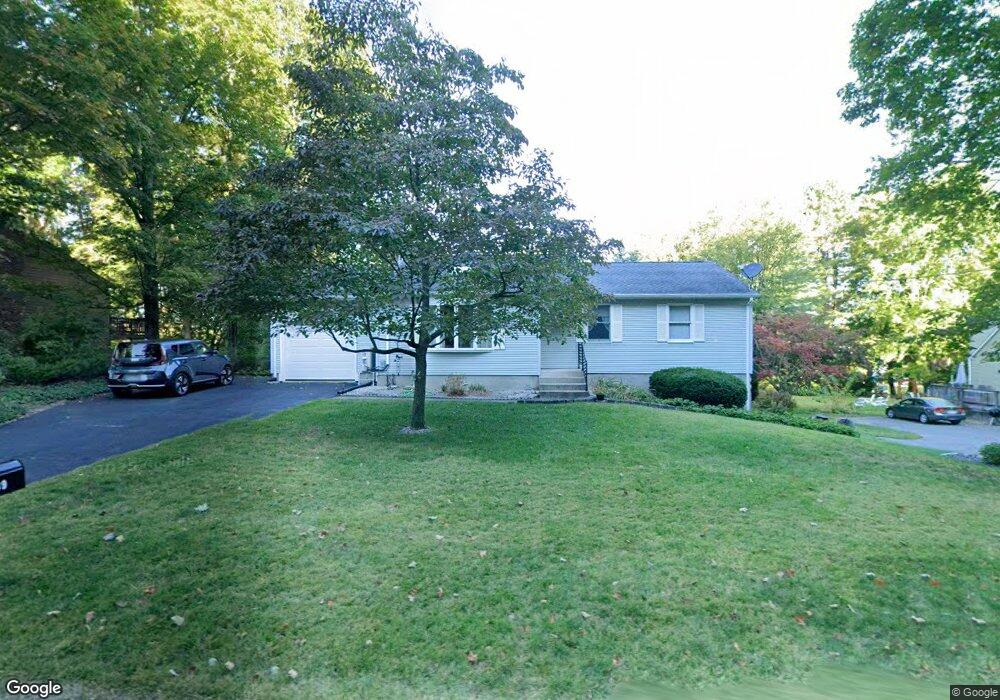
239 East St Easthampton, MA 01027
Estimated Value: $420,000 - $455,000
3
Beds
2
Baths
1,206
Sq Ft
$365/Sq Ft
Est. Value
About This Home
This home is located at 239 East St, Easthampton, MA 01027 and is currently estimated at $440,178, approximately $364 per square foot. 239 East St is a home located in Hampshire County with nearby schools including Easthampton High School, Hilltown Cooperative Charter Public School, and Tri-County Schools.
Ownership History
Date
Name
Owned For
Owner Type
Purchase Details
Closed on
May 29, 1992
Sold by
Boyle James F and Boyle Patricia A
Bought by
Glista Kelly C and Glista David S
Current Estimated Value
Home Financials for this Owner
Home Financials are based on the most recent Mortgage that was taken out on this home.
Original Mortgage
$103,540
Interest Rate
8.7%
Mortgage Type
Purchase Money Mortgage
Create a Home Valuation Report for This Property
The Home Valuation Report is an in-depth analysis detailing your home's value as well as a comparison with similar homes in the area
Home Values in the Area
Average Home Value in this Area
Purchase History
| Date | Buyer | Sale Price | Title Company |
|---|---|---|---|
| Glista Kelly C | $118,000 | -- | |
| Weickum Margaret A | $105,000 | -- |
Source: Public Records
Mortgage History
| Date | Status | Borrower | Loan Amount |
|---|---|---|---|
| Open | Weickum Margaret A | $22,200 | |
| Closed | Weickum Margaret A | $103,540 | |
| Closed | Weickum Margaret A | $33,000 |
Source: Public Records
Tax History
| Year | Tax Paid | Tax Assessment Tax Assessment Total Assessment is a certain percentage of the fair market value that is determined by local assessors to be the total taxable value of land and additions on the property. | Land | Improvement |
|---|---|---|---|---|
| 2025 | $5,420 | $396,500 | $110,700 | $285,800 |
| 2024 | $5,321 | $392,400 | $107,500 | $284,900 |
| 2023 | $3,979 | $271,600 | $85,000 | $186,600 |
| 2022 | $4,490 | $271,600 | $85,000 | $186,600 |
| 2021 | $4,930 | $281,100 | $85,000 | $196,100 |
| 2020 | $4,824 | $271,600 | $85,000 | $186,600 |
| 2019 | $4,024 | $260,300 | $85,000 | $175,300 |
| 2018 | $3,850 | $240,600 | $80,400 | $160,200 |
| 2017 | $3,756 | $231,700 | $77,200 | $154,500 |
| 2016 | $3,746 | $240,300 | $77,200 | $163,100 |
| 2015 | $3,641 | $240,300 | $77,200 | $163,100 |
Source: Public Records
Map
Nearby Homes
- 10 Glen Cove Place Unit A
- 12 Glen Cove Place Unit B
- 2 Oak St
- 33 Knipfer Ave
- 19 Nicols Way Unit 19
- 11 Dragon Cir
- 457 Northampton St
- Lot 1 Edgewater Ln
- 296 Old Wilson Rd
- 18 Cedar St
- 283 South St
- 6 Wilton Rd
- 967 Florence Rd
- 57 Columbus Ave
- 41 South St Unit 11
- 385 Main St
- M143 &152 Glendale St
- 336 Main St
- 36 & 36R Holly Cir
- 6 S St & Abutting Lots
Your Personal Tour Guide
Ask me questions while you tour the home.