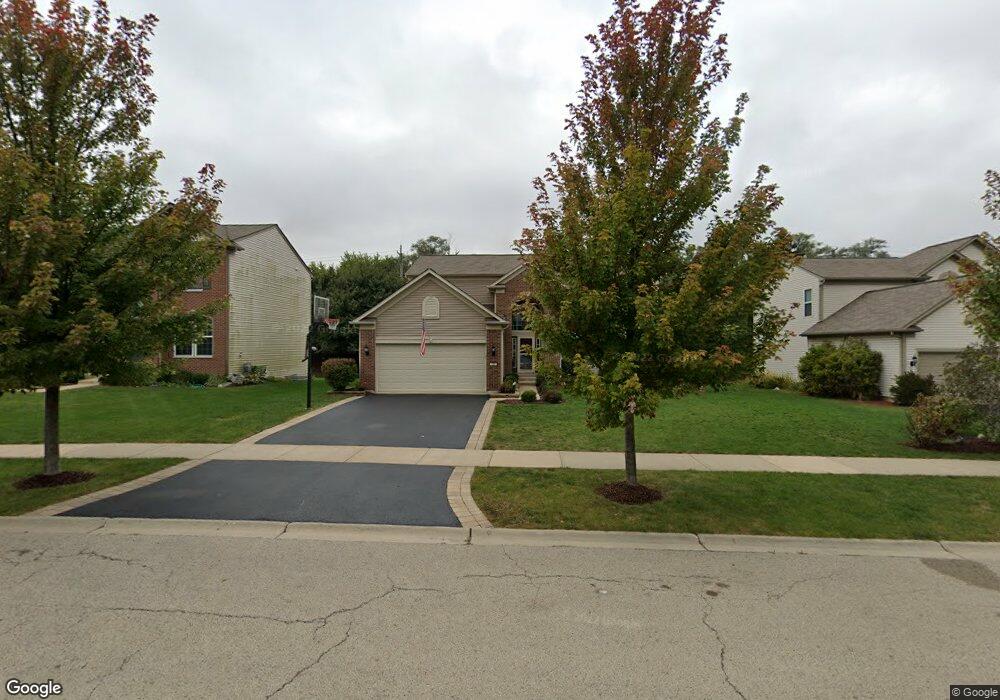
239 Foster Dr Oswego, IL 60543
North Oswego NeighborhoodEstimated Value: $482,250 - $501,000
4
Beds
3
Baths
2,427
Sq Ft
$203/Sq Ft
Est. Value
About This Home
This home is located at 239 Foster Dr, Oswego, IL 60543 and is currently estimated at $493,813, approximately $203 per square foot. 239 Foster Dr is a home located in Kendall County with nearby schools including Southbury Elementary School, Murphy Junior High School, and Oswego East High School.
Ownership History
Date
Name
Owned For
Owner Type
Purchase Details
Closed on
Feb 4, 2008
Sold by
Pulte Home Corp
Bought by
Quinn Michael R and Quinn Carrie A
Current Estimated Value
Home Financials for this Owner
Home Financials are based on the most recent Mortgage that was taken out on this home.
Original Mortgage
$325,603
Outstanding Balance
$203,656
Interest Rate
5.9%
Mortgage Type
Purchase Money Mortgage
Estimated Equity
$290,157
Create a Home Valuation Report for This Property
The Home Valuation Report is an in-depth analysis detailing your home's value as well as a comparison with similar homes in the area
Home Values in the Area
Average Home Value in this Area
Purchase History
| Date | Buyer | Sale Price | Title Company |
|---|---|---|---|
| Quinn Michael R | $343,000 | Pulte Midwest Title South |
Source: Public Records
Mortgage History
| Date | Status | Borrower | Loan Amount |
|---|---|---|---|
| Open | Quinn Michael R | $325,603 |
Source: Public Records
Tax History
| Year | Tax Paid | Tax Assessment Tax Assessment Total Assessment is a certain percentage of the fair market value that is determined by local assessors to be the total taxable value of land and additions on the property. | Land | Improvement |
|---|---|---|---|---|
| 2024 | $10,142 | $132,031 | $24,412 | $107,619 |
| 2023 | $8,966 | $115,817 | $21,414 | $94,403 |
| 2022 | $8,966 | $105,288 | $19,467 | $85,821 |
| 2021 | $8,911 | $101,238 | $18,718 | $82,520 |
| 2020 | $8,631 | $97,344 | $17,998 | $79,346 |
| 2019 | $8,405 | $93,566 | $17,998 | $75,568 |
| 2018 | $8,680 | $92,435 | $23,761 | $68,674 |
| 2017 | $8,721 | $91,069 | $23,410 | $67,659 |
| 2016 | $8,572 | $88,416 | $22,728 | $65,688 |
| 2015 | $8,360 | $82,632 | $21,241 | $61,391 |
| 2014 | -- | $79,454 | $20,424 | $59,030 |
| 2013 | -- | $80,256 | $20,630 | $59,626 |
Source: Public Records
Map
Nearby Homes
- 100 Devoe Dr Unit 466
- 375 Danforth Dr
- 377 Danforth Dr
- 115 Henderson St
- 120 Henderson St
- 126 Henderson St
- 379 Danforth Dr
- 385 Danforth Dr
- 388 Danforth Dr
- 387 Danforth Dr
- 342 Danforth Dr
- 390 Danforth Dr
- 413 Hathaway Ln
- 415 Hathaway Ln
- 417 Hathaway Ln
- 419 Hathaway Ln
- 421 Hathaway Ln
- Meadowlark Plan at Hudson Pointe - II - Horizon Series
- Starling Plan at Hudson Pointe - II - Horizon Series
- Townsend Plan at Hudson Pointe - II - Horizon Series
Your Personal Tour Guide
Ask me questions while you tour the home.