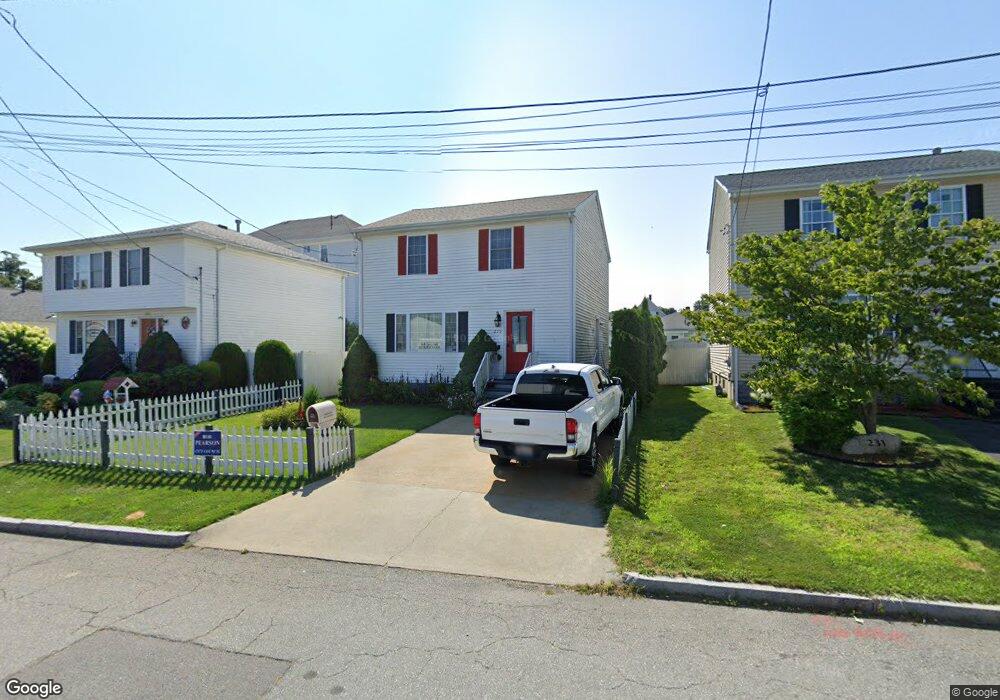
239 Lapham St Fall River, MA 02721
Niagara NeighborhoodEstimated Value: $296,000 - $432,000
3
Beds
2
Baths
1,456
Sq Ft
$256/Sq Ft
Est. Value
About This Home
This home is located at 239 Lapham St, Fall River, MA 02721 and is currently estimated at $372,069, approximately $255 per square foot. 239 Lapham St is a home located in Bristol County with nearby schools including William S Greene, Talbot Innovation School, and B M C Durfee High School.
Ownership History
Date
Name
Owned For
Owner Type
Purchase Details
Closed on
Aug 26, 1999
Sold by
Cabral Timothy
Bought by
Menezes Manuel H and Menezes Mary Jo
Current Estimated Value
Home Financials for this Owner
Home Financials are based on the most recent Mortgage that was taken out on this home.
Original Mortgage
$94,320
Interest Rate
7.53%
Mortgage Type
Purchase Money Mortgage
Create a Home Valuation Report for This Property
The Home Valuation Report is an in-depth analysis detailing your home's value as well as a comparison with similar homes in the area
Home Values in the Area
Average Home Value in this Area
Purchase History
| Date | Buyer | Sale Price | Title Company |
|---|---|---|---|
| Menezes Manuel H | $117,900 | -- |
Source: Public Records
Mortgage History
| Date | Status | Borrower | Loan Amount |
|---|---|---|---|
| Open | Menezes Manuel H | $130,000 | |
| Closed | Menezes Manuel H | $94,320 |
Source: Public Records
Tax History
| Year | Tax Paid | Tax Assessment Tax Assessment Total Assessment is a certain percentage of the fair market value that is determined by local assessors to be the total taxable value of land and additions on the property. | Land | Improvement |
|---|---|---|---|---|
| 2025 | $3,383 | $295,500 | $107,100 | $188,400 |
| 2024 | $3,172 | $276,100 | $103,100 | $173,000 |
| 2023 | $3,167 | $258,100 | $85,200 | $172,900 |
| 2022 | $2,823 | $223,700 | $81,200 | $142,500 |
| 2021 | $2,751 | $198,900 | $77,200 | $121,700 |
| 2020 | $2,743 | $189,800 | $76,100 | $113,700 |
| 2019 | $2,656 | $182,200 | $73,300 | $108,900 |
| 2018 | $2,652 | $181,400 | $79,300 | $102,100 |
| 2017 | $2,461 | $175,800 | $75,600 | $100,200 |
| 2016 | $2,376 | $174,300 | $80,500 | $93,800 |
| 2015 | $2,310 | $176,600 | $80,500 | $96,100 |
| 2014 | $2,191 | $174,200 | $78,100 | $96,100 |
Source: Public Records
Map
Nearby Homes
Your Personal Tour Guide
Ask me questions while you tour the home.