
Seller's Agent in 2022
Brittany Reidy
Coldwell Banker Realty Portsmouth NH
(603) 682-8270
1 in this area
66 Total Sales
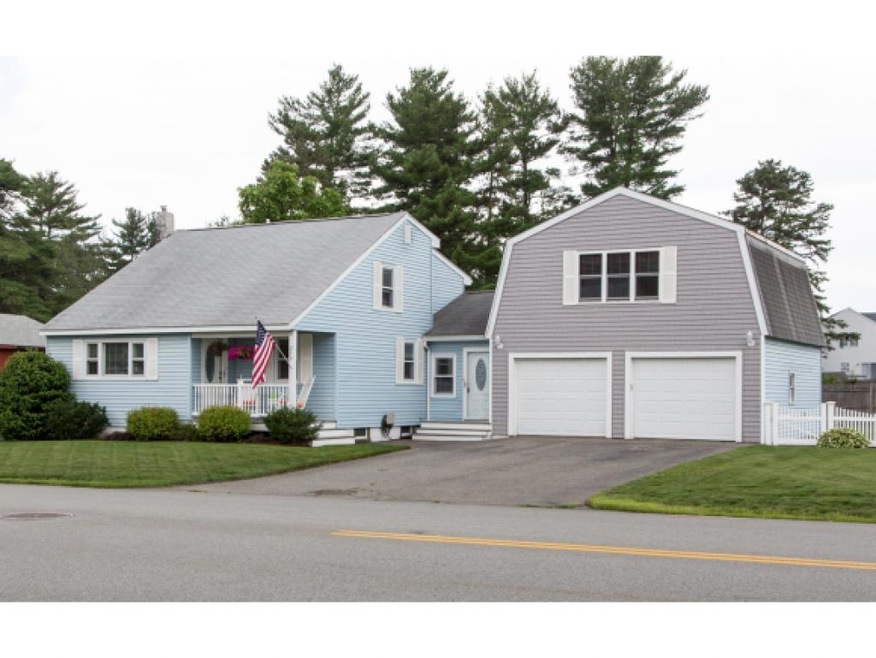
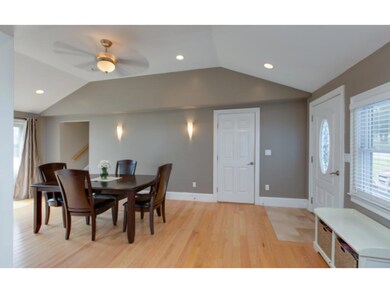
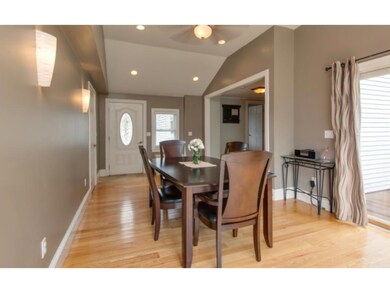
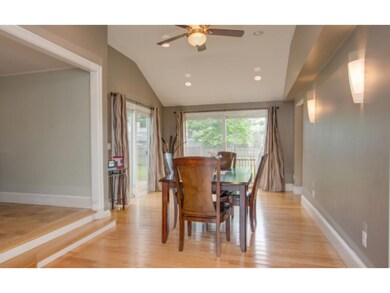
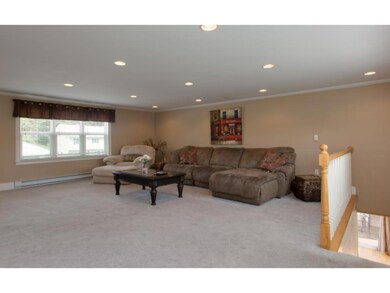
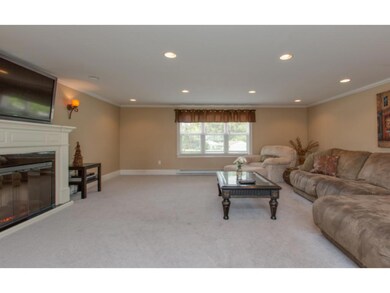
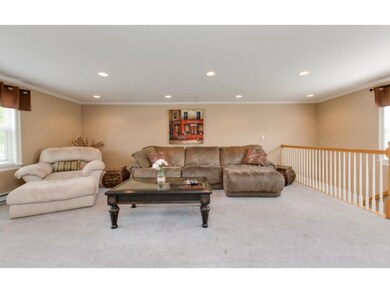
Prepare to be wowed by this nicely updated and oversized 4BR Cape in excellent location close to shopping, dining and major routes. Adorable farmer's porch, completely fenced yard with irrigation and a new deck are just a few of the home's exterior highlights. Once inside, you'll find a formal DR, beautifully upgraded kitchen with Corian countertops, tile floor and breakfast bar. 1st floor bedroom & 1st floor BA (completely updated!) are perfect for guests or those needing one-level living. Huge family room over garage in addition to the living room off of the kitchen. The 3 bedrooms upstairs have new carpets and the Master BR has an oversized walk-in closet. Half of the basement is finished with the other half perfect for storage. Come take a look!
Last Agent to Sell the Property
BHHS Verani Londonderry License #060319 Listed on: 07/09/2015
| Date | Type | Sale Price | Title Company |
|---|---|---|---|
| Quit Claim Deed | -- | -- | |
| Warranty Deed | $294,933 | -- | |
| Deed | $300,000 | -- | |
| Warranty Deed | $239,000 | -- | |
| Warranty Deed | $70,800 | -- | |
| Warranty Deed | $93,900 | -- |
| Date | Status | Loan Amount | Loan Type |
|---|---|---|---|
| Previous Owner | $289,558 | FHA | |
| Previous Owner | $240,000 | Purchase Money Mortgage | |
| Previous Owner | $167,900 | No Value Available | |
| Previous Owner | $140,100 | No Value Available | |
| Previous Owner | $93,900 | No Value Available |
| Date | Event | Price | Change | Sq Ft Price |
|---|---|---|---|---|
| 04/29/2022 04/29/22 | Sold | $460,000 | +7.0% | $221 / Sq Ft |
| 03/24/2022 03/24/22 | Pending | -- | -- | -- |
| 03/22/2022 03/22/22 | For Sale | $429,900 | 0.0% | $206 / Sq Ft |
| 03/22/2022 03/22/22 | Price Changed | $429,900 | -6.5% | $206 / Sq Ft |
| 03/11/2022 03/11/22 | Off Market | $460,000 | -- | -- |
| 02/27/2022 02/27/22 | Pending | -- | -- | -- |
| 02/18/2022 02/18/22 | For Sale | $449,900 | +52.6% | $216 / Sq Ft |
| 09/25/2015 09/25/15 | Sold | $294,900 | 0.0% | $142 / Sq Ft |
| 08/14/2015 08/14/15 | Pending | -- | -- | -- |
| 07/09/2015 07/09/15 | For Sale | $294,900 | -- | $142 / Sq Ft |
| Year | Tax Paid | Tax Assessment Tax Assessment Total Assessment is a certain percentage of the fair market value that is determined by local assessors to be the total taxable value of land and additions on the property. | Land | Improvement |
|---|---|---|---|---|
| 2023 | $7,153 | $392,400 | $120,800 | $271,600 |
| 2022 | $7,091 | $392,400 | $120,800 | $271,600 |
| 2021 | $6,629 | $285,500 | $80,600 | $204,900 |
| 2020 | $6,455 | $285,500 | $80,600 | $204,900 |
| 2019 | $6,212 | $285,500 | $80,600 | $204,900 |
| 2018 | $6,055 | $285,500 | $80,600 | $204,900 |
| 2017 | $5,390 | $209,000 | $69,800 | $139,200 |
| 2016 | $5,240 | $209,000 | $69,800 | $139,200 |
| 2015 | $5,100 | $207,900 | $70,000 | $137,900 |
| 2014 | $5,000 | $207,900 | $70,000 | $137,900 |
Seller's Agent in 2022
Brittany Reidy
Coldwell Banker Realty Portsmouth NH
(603) 682-8270
1 in this area
66 Total Sales
Seller Co-Listing Agent in 2022
Jim Cardello
BHHS Verani Londonderry
(603) 568-1576
2 in this area
105 Total Sales
Buyer's Agent in 2022
Cynthia Johnson
Cynthia Johnson
(603) 305-6976
1 in this area
30 Total Sales
Seller's Agent in 2015
Rebecca Digregorio
BHHS Verani Londonderry
(603) 315-5152
99 Total Sales
Buyer's Agent in 2015
Robert Holder
KW Coastal and Lakes & Mountains Realty
(603) 801-4193
25 Total Sales
Source: PrimeMLS
MLS Number: 4436732
APN: NASH-000000-000000-000224B
Disclaimer: Certain information contained herein is derived from information provided by parties other than Homes.com. All information provided is deemed reliable, but is not guaranteed to be accurate and should be independently verified.
![]() Copyright 2025 PrimeMLS, Inc. All rights reserved. This information is deemed reliable, but not guaranteed. The data relating to real estate displayed on this display comes in part from the IDX Program of PrimeMLS. The information being provided is for consumers’ personal, non-commercial use and may not be used for any purpose other than to identify prospective properties consumers may be interested in purchasing.
Copyright 2025 PrimeMLS, Inc. All rights reserved. This information is deemed reliable, but not guaranteed. The data relating to real estate displayed on this display comes in part from the IDX Program of PrimeMLS. The information being provided is for consumers’ personal, non-commercial use and may not be used for any purpose other than to identify prospective properties consumers may be interested in purchasing.