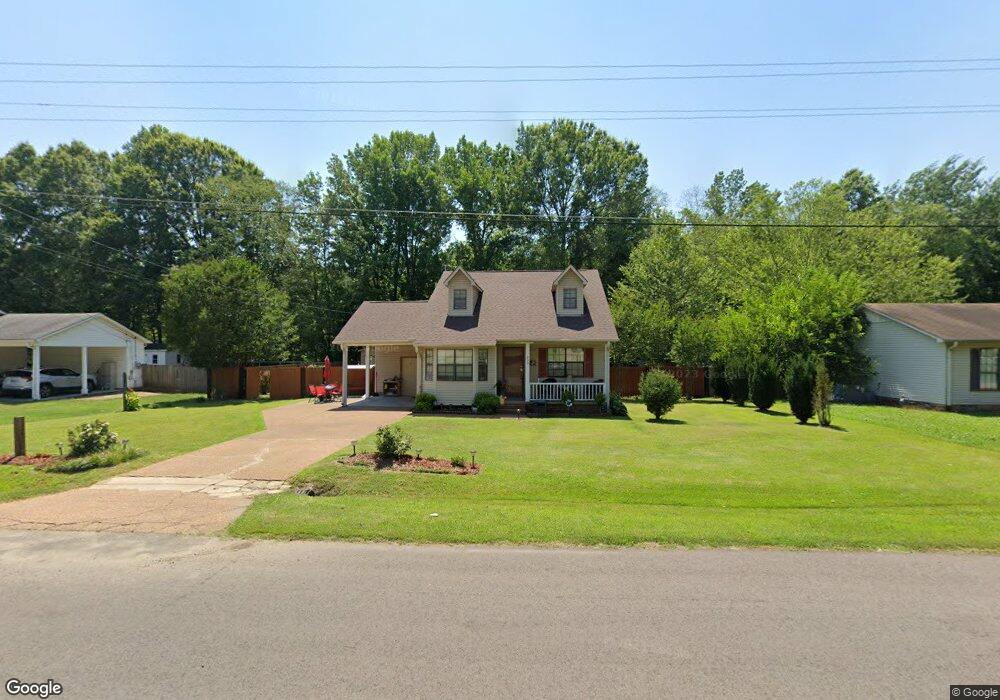
239 McGee Loop Jackson, TN 38305
Estimated Value: $166,601 - $226,000
Studio
3
Baths
1,760
Sq Ft
$111/Sq Ft
Est. Value
About This Home
This home is located at 239 McGee Loop, Jackson, TN 38305 and is currently estimated at $194,900, approximately $110 per square foot. 239 McGee Loop is a home located in Madison County with nearby schools including East Elementary School, Northeast Middle School, and North Side High School.
Ownership History
Date
Name
Owned For
Owner Type
Purchase Details
Closed on
Oct 29, 2004
Sold by
Sullivan Brian P
Bought by
Chessor Shelly V
Current Estimated Value
Home Financials for this Owner
Home Financials are based on the most recent Mortgage that was taken out on this home.
Original Mortgage
$88,450
Outstanding Balance
$42,839
Interest Rate
5.65%
Estimated Equity
$152,061
Purchase Details
Closed on
Jun 28, 2002
Sold by
Brooks Christopher A
Bought by
Sullivan Brian P
Home Financials for this Owner
Home Financials are based on the most recent Mortgage that was taken out on this home.
Original Mortgage
$80,634
Interest Rate
6.75%
Purchase Details
Closed on
Feb 27, 1998
Sold by
Hollingsworth Karen J
Bought by
Brooks Christopher A
Purchase Details
Closed on
Nov 3, 1993
Sold by
Geo Bennett
Bought by
Karen Hollingsworth
Purchase Details
Closed on
Apr 12, 1993
Bought by
Bennett George F
Purchase Details
Closed on
Apr 8, 1955
Bought by
Mcgee James C
Create a Home Valuation Report for This Property
The Home Valuation Report is an in-depth analysis detailing your home's value as well as a comparison with similar homes in the area
Purchase History
| Date | Buyer | Sale Price | Title Company |
|---|---|---|---|
| Chessor Shelly V | $85,900 | -- | |
| Sullivan Brian P | $81,900 | -- | |
| Brooks Christopher A | $78,000 | -- | |
| Karen Hollingsworth | $58,000 | -- | |
| Bennett George F | -- | -- | |
| Mcgee James C | -- | -- |
Source: Public Records
Mortgage History
| Date | Status | Borrower | Loan Amount |
|---|---|---|---|
| Open | Mcgee James C | $88,450 | |
| Previous Owner | Mcgee James C | $80,634 |
Source: Public Records
Tax History
| Year | Tax Paid | Tax Assessment Tax Assessment Total Assessment is a certain percentage of the fair market value that is determined by local assessors to be the total taxable value of land and additions on the property. | Land | Improvement |
|---|---|---|---|---|
| 2025 | $667 | $35,625 | $5,000 | $30,625 |
| 2024 | $667 | $35,625 | $5,000 | $30,625 |
| 2022 | $667 | $35,625 | $5,000 | $30,625 |
| 2021 | $501 | $21,300 | $3,150 | $18,150 |
| 2020 | $501 | $21,300 | $3,150 | $18,150 |
| 2019 | $501 | $21,300 | $3,150 | $18,150 |
| 2018 | $494 | $21,025 | $3,150 | $17,875 |
| 2017 | $503 | $20,525 | $3,150 | $17,375 |
| 2016 | $441 | $20,525 | $3,150 | $17,375 |
| 2015 | $441 | $20,525 | $3,150 | $17,375 |
| 2014 | $441 | $20,525 | $3,150 | $17,375 |
Source: Public Records
Map
Nearby Homes
- 99 Hidden Valley Dr
- 91 McGee Loop
- 0 Red Gum Ln & Old Medina Crossing Ln Unit 10195533
- 85 Old Medina Crossing
- 111 Henderson Rd
- 24 Palmetto Cove
- 0 Interstate 40 Unit 2505648
- 0 Interstate 40
- 0 U S Highway 412
- 31 Mack St
- 62 Beth Place
- 2888 Old Medina Rd
- 130 Campbell Oaks Dr
- 21 Bluebird Cove
- 5 Brentmeade Cove
- 20 Bink Dr
- 53 Jackson Creek Dr
- 00 Chloe Place
- 189 Valley Oak Loop
- 95 Woodgrove Dr
- 231 McGee Loop
- 11 Dyer Creek Ln
- 223 McGee Loop
- 19 Dyer Creek Ln
- 242 McGee Loop
- 16 McGee Loop
- 234 McGee Loop
- 27 Dyer Creek Ln
- 215 McGee Loop
- 129 Lost Creek Dr
- 268 McGee Loop
- 34 Dyer Creek Ln
- 119 Lost Creek Dr
- 207 McGee Loop
- 33 Dyer Creek Ln
- 111 Lost Creek Dr
- 278 McGee Loop
- 130 Lost Creek Dr
- 48 Dyer Creek Ln
- 39 Dyer Creek Ln
Your Personal Tour Guide
Ask me questions while you tour the home.