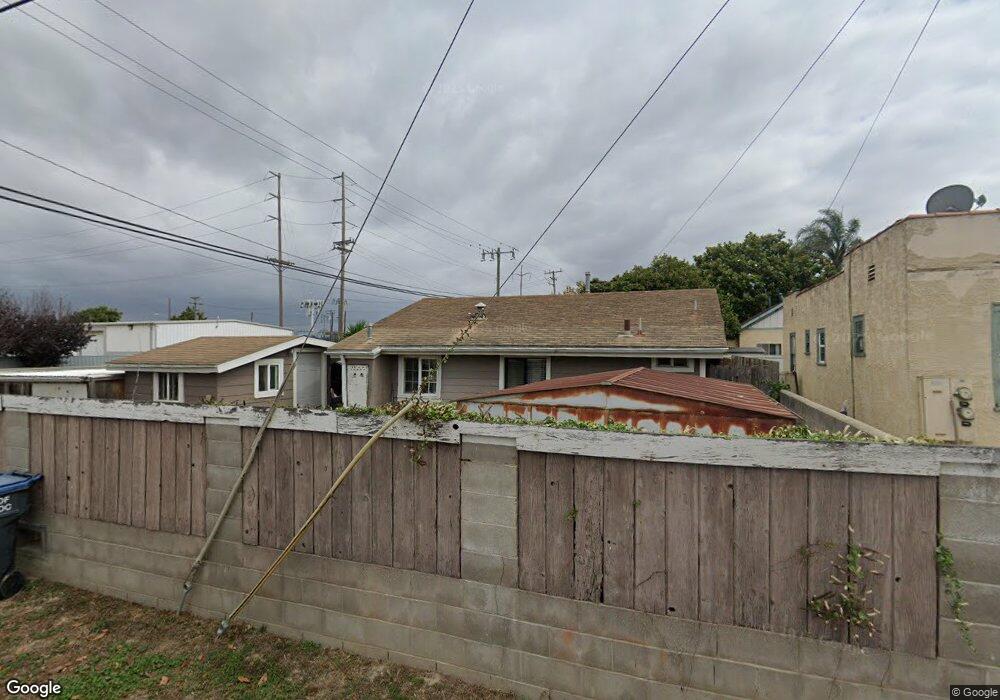
239 N F St Lompoc, CA 93436
Estimated Value: $455,797 - $634,000
3
Beds
1
Bath
1,596
Sq Ft
$331/Sq Ft
Est. Value
About This Home
This home is located at 239 N F St, Lompoc, CA 93436 and is currently estimated at $527,949, approximately $330 per square foot. 239 N F St is a home located in Santa Barbara County with nearby schools including Arthur Hapgood Elementary School, Lompoc Valley Middle School, and Lompoc High School.
Ownership History
Date
Name
Owned For
Owner Type
Purchase Details
Closed on
Aug 17, 2001
Sold by
Lara Alfred E and Lara Rose G
Bought by
Crandall Bradley J and Crandall Julie A
Current Estimated Value
Home Financials for this Owner
Home Financials are based on the most recent Mortgage that was taken out on this home.
Original Mortgage
$95,000
Outstanding Balance
$36,629
Interest Rate
6.99%
Mortgage Type
Seller Take Back
Estimated Equity
$491,320
Create a Home Valuation Report for This Property
The Home Valuation Report is an in-depth analysis detailing your home's value as well as a comparison with similar homes in the area
Home Values in the Area
Average Home Value in this Area
Purchase History
| Date | Buyer | Sale Price | Title Company |
|---|---|---|---|
| Crandall Bradley J | $100,000 | Chicago Title Co |
Source: Public Records
Mortgage History
| Date | Status | Borrower | Loan Amount |
|---|---|---|---|
| Open | Crandall Bradley J | $95,000 |
Source: Public Records
Tax History Compared to Growth
Tax History
| Year | Tax Paid | Tax Assessment Tax Assessment Total Assessment is a certain percentage of the fair market value that is determined by local assessors to be the total taxable value of land and additions on the property. | Land | Improvement |
|---|---|---|---|---|
| 2025 | $1,917 | $180,206 | $110,785 | $69,421 |
| 2023 | $1,917 | $173,210 | $106,484 | $66,726 |
| 2022 | $1,880 | $169,815 | $104,397 | $65,418 |
| 2021 | $1,898 | $166,486 | $102,350 | $64,136 |
| 2020 | $1,877 | $164,780 | $101,301 | $63,479 |
| 2019 | $1,844 | $161,550 | $99,315 | $62,235 |
| 2018 | $1,814 | $158,383 | $97,368 | $61,015 |
| 2017 | $1,779 | $155,278 | $95,459 | $59,819 |
| 2016 | $1,745 | $152,235 | $93,588 | $58,647 |
| 2014 | $1,705 | $147,014 | $90,378 | $56,636 |
Source: Public Records
Map
Nearby Homes
- 224 N F St
- 220 N F St
- 315 E Chestnut Ave
- 122 N G St
- 801, 851 California 246
- 135 N J St
- 510 N I St
- 215 S H St
- 516 N L St
- 610 E Pine Ave Unit Space 73
- 610 E Pine Ave Unit 17
- 333 S J St
- 424 N 2nd St
- 615 N 1st St
- 214 S O St
- 1210 E Walnut Ave Unit D
- 1200 Peach Ave
- 531 N O St
- 701 E Pine Ave Unit 182
- 701 E Pine Ave Unit 176