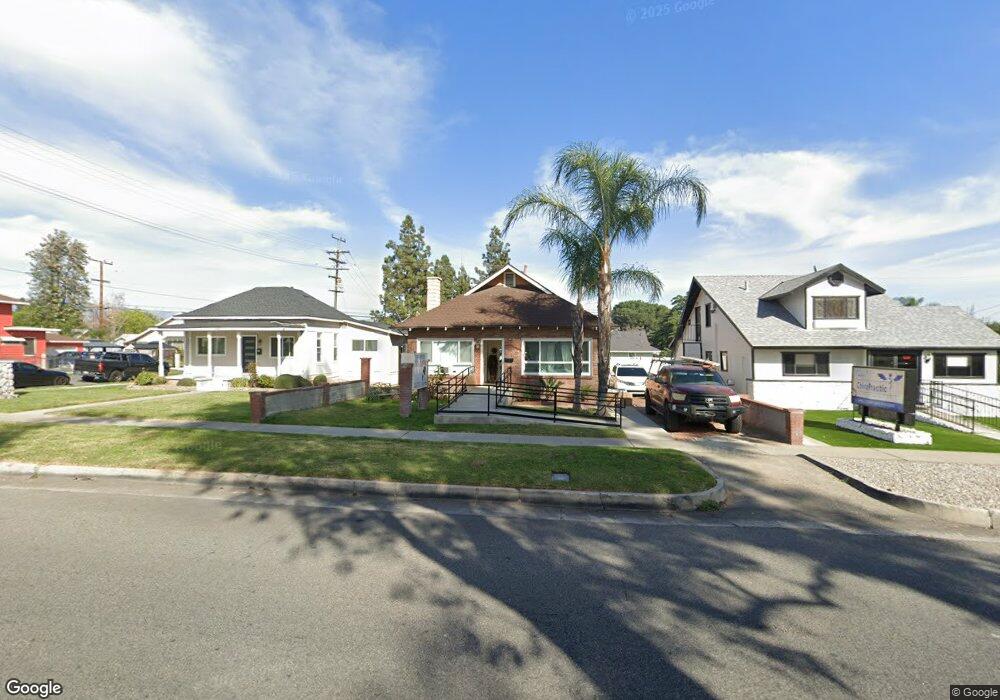
239 N Riverside Ave Rialto, CA 92376
Estimated Value: $581,323
Studio
--
Bath
1,658
Sq Ft
$351/Sq Ft
Est. Value
About This Home
This home is located at 239 N Riverside Ave, Rialto, CA 92376 and is currently estimated at $581,323, approximately $350 per square foot. 239 N Riverside Ave is a home located in San Bernardino County with nearby schools including Sam V. Curtis Elementary School, Rialto Middle School, and Eisenhower High School.
Ownership History
Date
Name
Owned For
Owner Type
Purchase Details
Closed on
Sep 14, 2007
Sold by
Mermilliod Stephen Paul
Bought by
Sanchez Leticia
Current Estimated Value
Home Financials for this Owner
Home Financials are based on the most recent Mortgage that was taken out on this home.
Original Mortgage
$35,000
Interest Rate
6.38%
Mortgage Type
Commercial
Purchase Details
Closed on
Jul 25, 1995
Sold by
Hendrick Charlie R
Bought by
Hendrick Maria
Purchase Details
Closed on
Mar 29, 1994
Sold by
Mermilliod Stephen Paul
Bought by
Mermilliod Stephen Paul
Purchase Details
Closed on
Apr 9, 1991
Sold by
Janczar Bozena Grazyna
Bought by
Mermilliod Stephen Paul
Create a Home Valuation Report for This Property
The Home Valuation Report is an in-depth analysis detailing your home's value as well as a comparison with similar homes in the area
Home Values in the Area
Average Home Value in this Area
Purchase History
| Date | Buyer | Sale Price | Title Company |
|---|---|---|---|
| Sanchez Leticia | $350,000 | Stewart Title | |
| Sanchez Leticia | -- | Stewart Title | |
| Hendrick Maria | -- | Chicago Title Co | |
| Mermilliod Stephen Paul | -- | World Title Company | |
| Mermilliod Stephen Paul | -- | World Title Company |
Source: Public Records
Mortgage History
| Date | Status | Borrower | Loan Amount |
|---|---|---|---|
| Previous Owner | Sanchez Leticia | $35,000 | |
| Previous Owner | Sanchez Leticia | $280,000 |
Source: Public Records
Tax History
| Year | Tax Paid | Tax Assessment Tax Assessment Total Assessment is a certain percentage of the fair market value that is determined by local assessors to be the total taxable value of land and additions on the property. | Land | Improvement |
|---|---|---|---|---|
| 2025 | $5,690 | $459,732 | $157,623 | $302,109 |
| 2024 | $5,489 | $450,717 | $154,532 | $296,185 |
| 2023 | $5,858 | $441,879 | $151,502 | $290,377 |
| 2022 | $5,435 | $433,214 | $148,531 | $284,683 |
| 2021 | $5,400 | $424,720 | $145,619 | $279,101 |
| 2020 | $5,437 | $420,365 | $144,126 | $276,239 |
| 2019 | $5,311 | $412,123 | $141,300 | $270,823 |
| 2018 | $5,154 | $404,042 | $138,529 | $265,513 |
| 2017 | $5,114 | $396,120 | $135,813 | $260,307 |
| 2016 | $5,057 | $388,353 | $133,150 | $255,203 |
| 2015 | $5,079 | $382,520 | $131,150 | $251,370 |
| 2014 | $4,774 | $375,027 | $128,581 | $246,446 |
Source: Public Records
Map
Nearby Homes
- 228 N Orange Ave
- 117 N Orange Ave
- 140 W Grove St
- 565 N Riverside Ave
- 530 N Sycamore Ave
- 352 Alice Ave
- 230 N Millard Ave
- 538 N Oakdale Ave
- 332 E Rosewood St
- 508 N Joyce Ave
- 525 E 3rd St
- 114 S Acacia Ave
- 361 Allen St
- 133 E Van Koevering St
- 214 Bonita Ln
- 230 E Wilson St
- 580 W 3rd St
- 600 June St
- 160 S Eucalyptus Ave
- 160 S Eucalyptus Ave Unit 60
- 245 N Riverside Ave
- 237 N Riverside Ave
- 233 N Riverside Ave
- 111 E 3rd St
- 238 N Olive Ave
- 301 N Riverside Ave
- 232 N Olive Ave
- 230 N Olive Ave
- 311 N Riverside Ave
- 112 E 3rd St
- 224 N Olive Ave
- 317 N Riverside Ave
- 116 E 3rd St
- 290 N Riverside Ave
- 220 N Olive Ave
- 230 N Riverside Ave
- 238 N Riverside Ave
- 238 N Riverside Ave Unit 3 suites
- 238 N Riverside Ave Unit C
- 325 N Riverside Ave
Your Personal Tour Guide
Ask me questions while you tour the home.