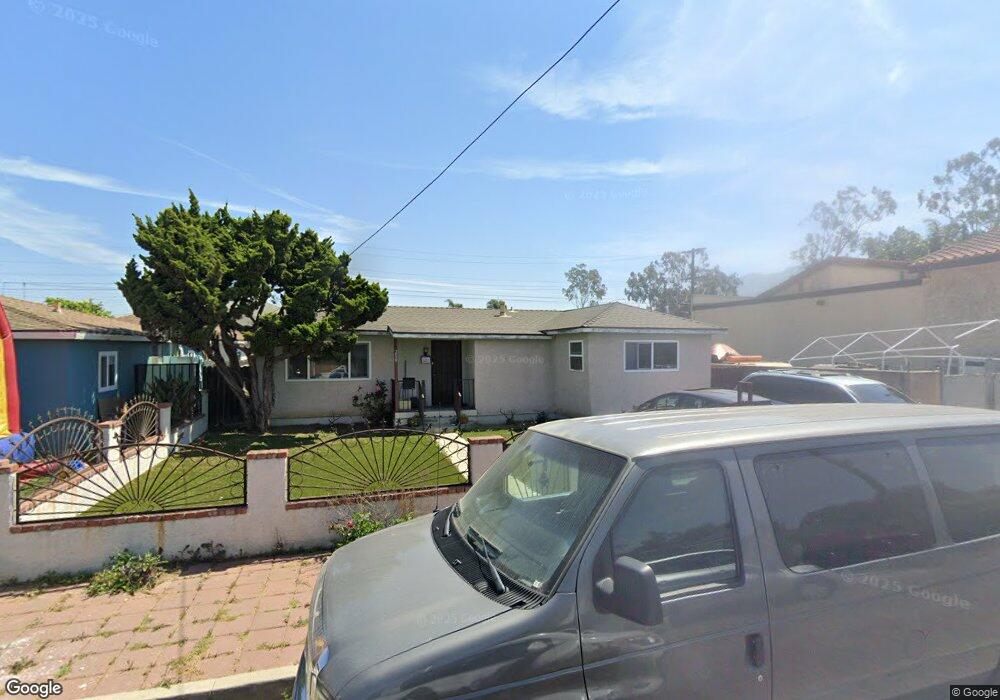
239 Stanford St Santa Paula, CA 93060
Estimated Value: $507,234 - $588,000
2
Beds
1
Bath
770
Sq Ft
$697/Sq Ft
Est. Value
About This Home
This home is located at 239 Stanford St, Santa Paula, CA 93060 and is currently estimated at $536,309, approximately $696 per square foot. 239 Stanford St is a home located in Ventura County with nearby schools including Grace S. Thille Elementary School, Isbell Middle, and Santa Paula High.
Ownership History
Date
Name
Owned For
Owner Type
Purchase Details
Closed on
Feb 4, 2009
Sold by
Deutsche Bank National Trust Company
Bought by
Linden Sara K Vander
Current Estimated Value
Home Financials for this Owner
Home Financials are based on the most recent Mortgage that was taken out on this home.
Original Mortgage
$142,704
Outstanding Balance
$89,285
Interest Rate
4.91%
Mortgage Type
FHA
Estimated Equity
$447,024
Purchase Details
Closed on
Nov 14, 2008
Sold by
Martinez Atilano Christina
Bought by
Deutsche Bank National Trust Company
Purchase Details
Closed on
Jun 20, 2005
Sold by
Atilano Anthony
Bought by
Martinez Atilano Christina
Home Financials for this Owner
Home Financials are based on the most recent Mortgage that was taken out on this home.
Original Mortgage
$314,000
Interest Rate
6.18%
Mortgage Type
Purchase Money Mortgage
Purchase Details
Closed on
Jan 29, 2003
Sold by
Atilano Christina Martinez and Martinez Maria Christina
Bought by
Atilano Anthony and Atilano Christina Martinez
Create a Home Valuation Report for This Property
The Home Valuation Report is an in-depth analysis detailing your home's value as well as a comparison with similar homes in the area
Home Values in the Area
Average Home Value in this Area
Purchase History
| Date | Buyer | Sale Price | Title Company |
|---|---|---|---|
| Linden Sara K Vander | $130,000 | Lawyers Title Company | |
| Deutsche Bank National Trust Company | $105,000 | None Available | |
| Martinez Atilano Christina | -- | Stewart Title Of Ca Inc | |
| Atilano Anthony | -- | -- |
Source: Public Records
Mortgage History
| Date | Status | Borrower | Loan Amount |
|---|---|---|---|
| Open | Linden Sara K Vander | $142,704 | |
| Previous Owner | Martinez Atilano Christina | $314,000 |
Source: Public Records
Tax History Compared to Growth
Tax History
| Year | Tax Paid | Tax Assessment Tax Assessment Total Assessment is a certain percentage of the fair market value that is determined by local assessors to be the total taxable value of land and additions on the property. | Land | Improvement |
|---|---|---|---|---|
| 2025 | $1,879 | $167,387 | $128,766 | $38,621 |
| 2024 | $1,879 | $164,105 | $126,241 | $37,864 |
| 2023 | $1,840 | $160,888 | $123,766 | $37,122 |
| 2022 | $1,785 | $157,734 | $121,339 | $36,395 |
| 2021 | $1,778 | $154,642 | $118,960 | $35,682 |
| 2020 | $1,768 | $153,059 | $117,742 | $35,317 |
| 2019 | $1,673 | $150,059 | $115,434 | $34,625 |
| 2018 | $1,651 | $147,118 | $113,171 | $33,947 |
| 2017 | $1,668 | $144,234 | $110,952 | $33,282 |
| 2016 | $1,569 | $141,407 | $108,777 | $32,630 |
| 2015 | $1,499 | $139,285 | $107,144 | $32,141 |
| 2014 | $1,521 | $136,559 | $105,047 | $31,512 |
Source: Public Records
Map
Nearby Homes
- 336 E Harvard Blvd
- 120 S Ojai St
- 154 E Santa Maria St
- 738 E Santa Paula St
- 107 Sonoma Ln
- 102 E Ventura St Unit D
- 102 E Ventura St Unit A
- 33 Outer Dr Unit 33
- 317 N Ojai St #Abcde
- 455 Snowdrop Ln
- 1856 Jojoba Dr
- 1865 Jojoba Dr
- 413 Checkerbloom Ln
- 1848 Jojoba Dr
- 919 E Virginia Terrace
- 421 N Palm Ave
- 0 View Dr Unit V1-32228
- 100 E Virginia Terrace
- 179 View Dr
- 1214 Saticoy St
- 233 Stanford St
- 735 Harvard Blvd
- 231 Stanford St
- 238 S 8th St
- 743 Harvard Blvd
- 234 Stanford St
- 227 Stanford St
- 717 E Harvard Blvd
- 230 Stanford St
- 223 Stanford St
- 226 Stanford St
- 226 S 8th St
- 709 E Harvard Blvd
- 222 S 8th St Unit 2
- 222 S 8th St
- 222 Stanford St
- 245 S 7th St
- 219 Stanford St
- 241 S 7th St
- 239 S 7th St