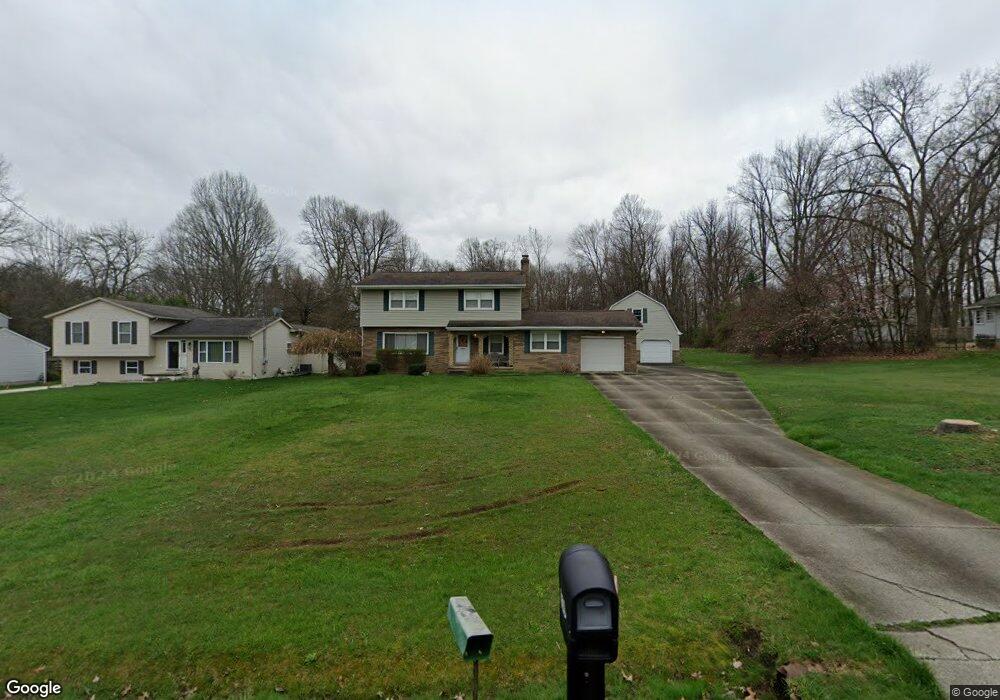
239 van Evera Rd Tallmadge, OH 44278
Goodyear Heights NeighborhoodEstimated Value: $318,000 - $381,000
5
Beds
4
Baths
2,143
Sq Ft
$161/Sq Ft
Est. Value
About This Home
This home is located at 239 van Evera Rd, Tallmadge, OH 44278 and is currently estimated at $345,787, approximately $161 per square foot. 239 van Evera Rd is a home located in Summit County with nearby schools including Tallmadge Middle School, Tallmadge High School, and Middlebury Academy.
Ownership History
Date
Name
Owned For
Owner Type
Purchase Details
Closed on
Oct 14, 2009
Sold by
Bernadine Wendy L
Bought by
Pinette Jason and Pinette Carrie
Current Estimated Value
Home Financials for this Owner
Home Financials are based on the most recent Mortgage that was taken out on this home.
Original Mortgage
$196,377
Outstanding Balance
$128,689
Interest Rate
5.15%
Mortgage Type
FHA
Estimated Equity
$217,098
Purchase Details
Closed on
Nov 12, 2008
Sold by
Bernadine Wendy L
Bought by
Allison Tiffany R
Home Financials for this Owner
Home Financials are based on the most recent Mortgage that was taken out on this home.
Original Mortgage
$156,601
Interest Rate
6.09%
Mortgage Type
Construction
Purchase Details
Closed on
Mar 31, 2006
Sold by
Clark Mary L and Clark Mary Lou
Bought by
Bernadine Wendy L
Home Financials for this Owner
Home Financials are based on the most recent Mortgage that was taken out on this home.
Original Mortgage
$183,120
Interest Rate
6.38%
Mortgage Type
Fannie Mae Freddie Mac
Create a Home Valuation Report for This Property
The Home Valuation Report is an in-depth analysis detailing your home's value as well as a comparison with similar homes in the area
Home Values in the Area
Average Home Value in this Area
Purchase History
| Date | Buyer | Sale Price | Title Company |
|---|---|---|---|
| Pinette Jason | $200,000 | Buckeye Title | |
| Allison Tiffany R | $39,900 | Buckeye Reserve Title Agency | |
| Bernadine Wendy L | $228,900 | Diamond Title Co |
Source: Public Records
Mortgage History
| Date | Status | Borrower | Loan Amount |
|---|---|---|---|
| Open | Pinette Jason | $196,377 | |
| Closed | Allison Tiffany R | $156,601 | |
| Previous Owner | Bernadine Wendy L | $183,120 |
Source: Public Records
Tax History Compared to Growth
Tax History
| Year | Tax Paid | Tax Assessment Tax Assessment Total Assessment is a certain percentage of the fair market value that is determined by local assessors to be the total taxable value of land and additions on the property. | Land | Improvement |
|---|---|---|---|---|
| 2025 | $4,280 | $85,569 | $16,111 | $69,458 |
| 2024 | $4,280 | $85,569 | $16,111 | $69,458 |
| 2023 | $4,280 | $85,569 | $16,111 | $69,458 |
| 2022 | $4,058 | $66,304 | $12,299 | $54,005 |
| 2021 | $4,076 | $66,304 | $12,299 | $54,005 |
| 2020 | $4,044 | $66,310 | $12,300 | $54,010 |
| 2019 | $4,235 | $62,030 | $14,220 | $47,810 |
| 2018 | $3,733 | $62,030 | $14,220 | $47,810 |
| 2017 | $3,536 | $62,030 | $14,220 | $47,810 |
| 2016 | $3,813 | $58,210 | $14,220 | $43,990 |
| 2015 | $3,536 | $58,210 | $14,220 | $43,990 |
| 2014 | $3,512 | $58,210 | $14,220 | $43,990 |
| 2013 | $3,460 | $58,390 | $14,220 | $44,170 |
Source: Public Records
Map
Nearby Homes
- 261 van Evera Rd
- 464 Carruthers Rd
- 75 Glenwood Cir
- 572 Eastglen Cir
- 1623 Romona Rd
- 926 Burbank Ave
- 93 Olalla Ave
- 1641 Slusser Rd
- 500 Dottie Ct Unit 109
- 130 Strecker Dr
- 159 Waterford Way Unit 44
- 1530 Indianola Ave
- 1498 Eastwood Ave
- 853 Brittain Rd
- 2330 Eastwood Ave
- 2333 Eastwood Ave
- 855 Cree Ave
- 2253 Tyro Ave
- 821 Cree Ave
- 580 Elko Ave
- 231 van Evera Rd
- 225 van Evera Rd
- 234 van Evera Rd
- 217 van Evera Rd
- 1317 Tallmadge View Ave
- 240 van Evera Rd
- 1323 Tallmadge View Ave
- 224 van Evera Rd
- 1313 Tallmadge View Ave
- 1329 Tallmadge View Ave
- 336 Tammery Dr
- 332 Tammery Dr
- 1804 Nanaula Dr
- 1335 Tallmadge View Ave
- 29 Oliver Rd
- 203 van Evera Rd
- 1341 Tallmadge View Ave
- 212 van Evera Rd
- 1798 Nanaula Dr
- 451 Narragansett Dr