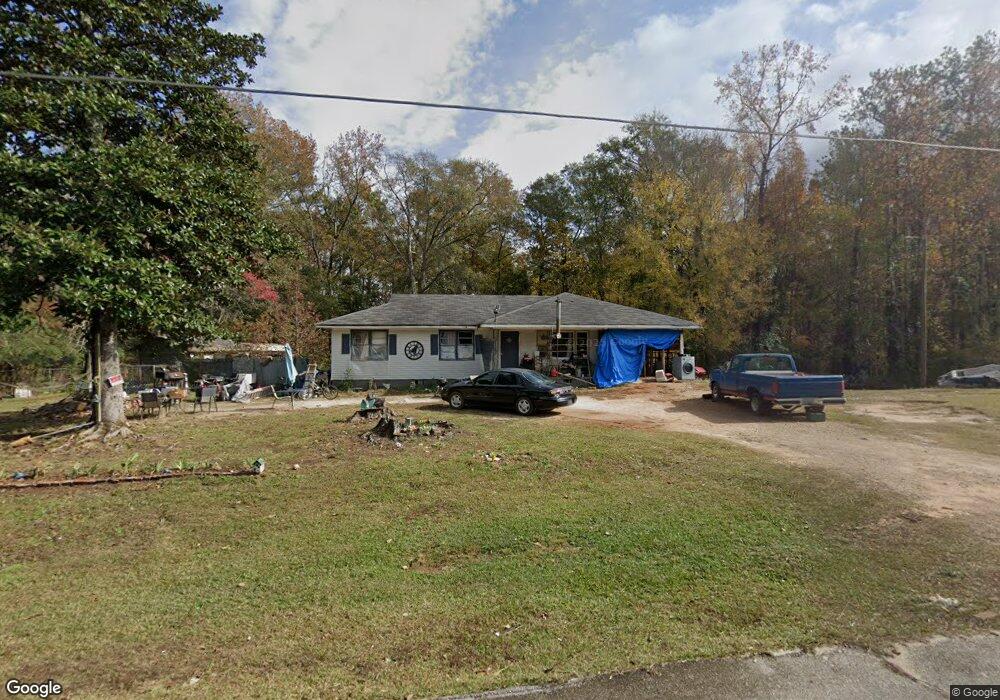
239 Wilcox Rd Lagrange, GA 30241
Estimated Value: $101,859 - $164,000
2
Beds
1
Bath
1,092
Sq Ft
$115/Sq Ft
Est. Value
About This Home
This home is located at 239 Wilcox Rd, Lagrange, GA 30241 and is currently estimated at $125,215, approximately $114 per square foot. 239 Wilcox Rd is a home located in Troup County with nearby schools including Whitesville Road Elementary School, Rosemont Elementary School, and Berta Weathersbee Elementary School.
Ownership History
Date
Name
Owned For
Owner Type
Purchase Details
Closed on
Sep 14, 2004
Sold by
Jimmy Standard
Bought by
Standard Robert H Jr
Current Estimated Value
Purchase Details
Closed on
Mar 6, 2001
Sold by
Robert H Standard Jr
Bought by
Jimmy Standard
Purchase Details
Closed on
Nov 12, 1999
Sold by
Mrs Mattie G Standard and Mrs Will
Bought by
Robert H Standard Jr
Purchase Details
Closed on
Jan 1, 1960
Bought by
Mrs Mattie G Standard and Mrs Will
Purchase Details
Closed on
Apr 16, 1959
Purchase Details
Closed on
Jan 1, 1959
Create a Home Valuation Report for This Property
The Home Valuation Report is an in-depth analysis detailing your home's value as well as a comparison with similar homes in the area
Purchase History
| Date | Buyer | Sale Price | Title Company |
|---|---|---|---|
| Standard Robert H Jr | -- | -- | |
| Jimmy Standard | -- | -- | |
| Robert H Standard Jr | -- | -- | |
| Mrs Mattie G Standard | -- | -- | |
| -- | -- | -- | |
| -- | -- | -- |
Source: Public Records
Tax History
| Year | Tax Paid | Tax Assessment Tax Assessment Total Assessment is a certain percentage of the fair market value that is determined by local assessors to be the total taxable value of land and additions on the property. | Land | Improvement |
|---|---|---|---|---|
| 2025 | $765 | $28,032 | $8,920 | $19,112 |
| 2024 | $676 | $24,792 | $8,920 | $15,872 |
| 2023 | $729 | $26,712 | $8,920 | $17,792 |
| 2022 | $167 | $25,752 | $8,920 | $16,832 |
| 2021 | $150 | $23,176 | $7,120 | $16,056 |
| 2020 | $348 | $21,496 | $5,440 | $16,056 |
| 2019 | $339 | $21,216 | $5,440 | $15,776 |
| 2018 | $296 | $19,792 | $5,440 | $14,352 |
| 2017 | $296 | $19,792 | $5,440 | $14,352 |
| 2016 | $282 | $19,318 | $5,440 | $13,878 |
| 2015 | $283 | $19,318 | $5,440 | $13,878 |
| 2014 | $324 | $20,668 | $5,440 | $15,228 |
| 2013 | -- | $21,634 | $5,440 | $16,194 |
Source: Public Records
Map
Nearby Homes
Your Personal Tour Guide
Ask me questions while you tour the home.