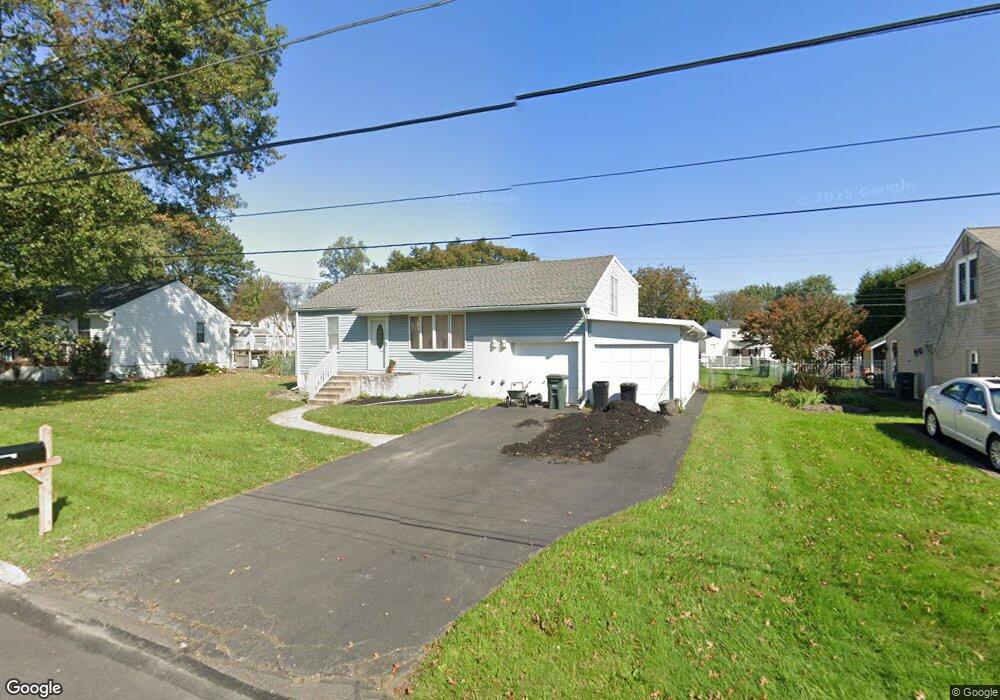
239 Williams Dr Southampton, PA 18966
Estimated Value: $364,000 - $450,000
--
Bed
1
Bath
953
Sq Ft
$414/Sq Ft
Est. Value
About This Home
This home is located at 239 Williams Dr, Southampton, PA 18966 and is currently estimated at $394,307, approximately $413 per square foot. 239 Williams Dr is a home located in Bucks County with nearby schools including Davis Elementary School, Klinger Middle School, and William Tennent High School.
Ownership History
Date
Name
Owned For
Owner Type
Purchase Details
Closed on
Jan 13, 2003
Sold by
Mcloughlin Martin R and Mcloughlin Sandra
Bought by
Bamberger Linda S
Current Estimated Value
Home Financials for this Owner
Home Financials are based on the most recent Mortgage that was taken out on this home.
Original Mortgage
$172,000
Outstanding Balance
$73,858
Interest Rate
6.11%
Estimated Equity
$320,449
Purchase Details
Closed on
Jun 7, 2002
Sold by
Mcloughlin Sandra
Bought by
Mcloughlin Martin R and Mcloughlin Sandra
Home Financials for this Owner
Home Financials are based on the most recent Mortgage that was taken out on this home.
Original Mortgage
$135,000
Interest Rate
5.87%
Purchase Details
Closed on
May 30, 1995
Sold by
Smith Terrence J and Smith Diane J
Bought by
Mcloughlin Sandra
Home Financials for this Owner
Home Financials are based on the most recent Mortgage that was taken out on this home.
Original Mortgage
$132,925
Interest Rate
7.8%
Mortgage Type
FHA
Create a Home Valuation Report for This Property
The Home Valuation Report is an in-depth analysis detailing your home's value as well as a comparison with similar homes in the area
Home Values in the Area
Average Home Value in this Area
Purchase History
| Date | Buyer | Sale Price | Title Company |
|---|---|---|---|
| Bamberger Linda S | $215,000 | -- | |
| Mcloughlin Martin R | -- | -- | |
| Mcloughlin Sandra | $133,000 | -- |
Source: Public Records
Mortgage History
| Date | Status | Borrower | Loan Amount |
|---|---|---|---|
| Open | Bamberger Linda S | $172,000 | |
| Previous Owner | Mcloughlin Martin R | $135,000 | |
| Previous Owner | Mcloughlin Sandra | $132,925 | |
| Closed | Mcloughlin Martin R | $45,500 |
Source: Public Records
Tax History Compared to Growth
Tax History
| Year | Tax Paid | Tax Assessment Tax Assessment Total Assessment is a certain percentage of the fair market value that is determined by local assessors to be the total taxable value of land and additions on the property. | Land | Improvement |
|---|---|---|---|---|
| 2025 | $4,038 | $18,880 | $5,520 | $13,360 |
| 2024 | $4,038 | $18,880 | $5,520 | $13,360 |
| 2023 | $3,915 | $18,880 | $5,520 | $13,360 |
| 2022 | $3,833 | $18,880 | $5,520 | $13,360 |
| 2021 | $3,764 | $18,880 | $5,520 | $13,360 |
| 2020 | $3,712 | $18,880 | $5,520 | $13,360 |
| 2019 | $3,575 | $18,880 | $5,520 | $13,360 |
| 2018 | $3,493 | $18,880 | $5,520 | $13,360 |
| 2017 | $3,394 | $18,880 | $5,520 | $13,360 |
| 2016 | $3,394 | $18,880 | $5,520 | $13,360 |
| 2015 | -- | $18,880 | $5,520 | $13,360 |
| 2014 | -- | $18,880 | $5,520 | $13,360 |
Source: Public Records
Map
Nearby Homes
- 766 Meadow Dr
- 215 Surrey Rd
- 202 E Hampton Crossing
- 615 Belmont Ave
- 206 E Hampton Crossing
- 325 Toll Dr
- 1244 Hiview Dr
- 665 Whirlaway Dr
- 559 Maple Ave
- 1081 Cherry Ln
- 19 Belmont Station
- 1310 Dennis Rd
- 52 Belmont Station
- 55 Belmont Station Unit G55
- 909 Carlin Dr
- 756 Street Rd Unit 17
- 433 Wendy Rd
- 415 New Rd
- 564 Byron Rd
- 185 Toll Dr