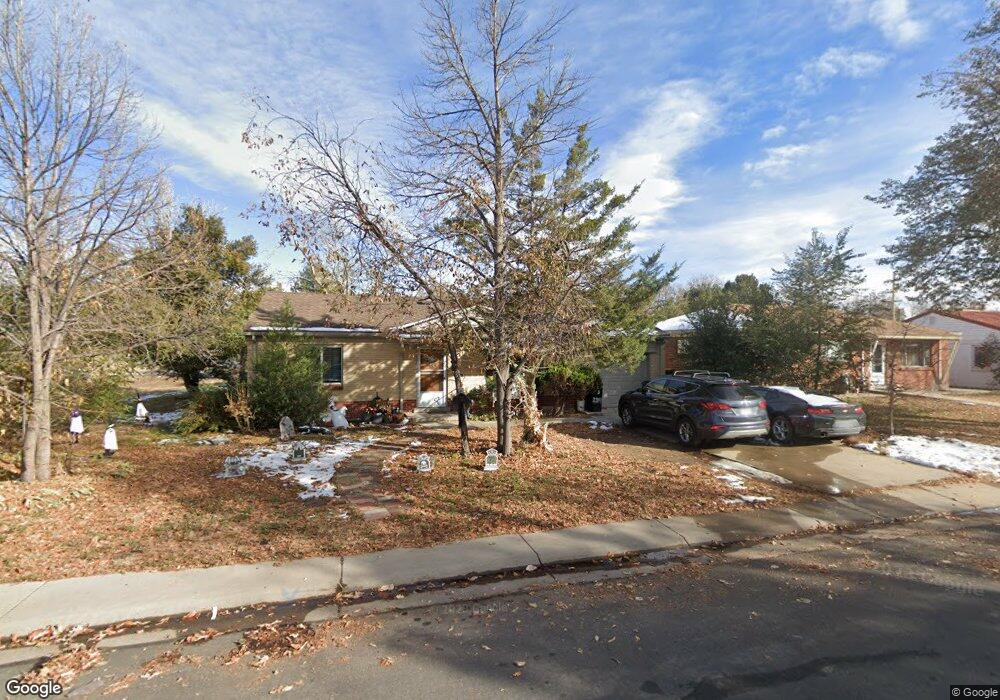
2390 Lansing St Aurora, CO 80010
North Aurora NeighborhoodEstimated Value: $403,778 - $482,000
3
Beds
1
Bath
1,421
Sq Ft
$304/Sq Ft
Est. Value
About This Home
This home is located at 2390 Lansing St, Aurora, CO 80010 and is currently estimated at $431,945, approximately $303 per square foot. 2390 Lansing St is a home located in Adams County with nearby schools including Montview Elementary School, Lincoln Elementary School, and Amargosa Creek Middle School.
Ownership History
Date
Name
Owned For
Owner Type
Purchase Details
Closed on
Dec 6, 2016
Sold by
Fronher Properties Llc
Bought by
Forntier Holdings Llc
Current Estimated Value
Purchase Details
Closed on
Jun 28, 2016
Sold by
Alsop Timothy A and Alsop Mary J
Bought by
Frontier Properties Llc
Purchase Details
Closed on
Feb 9, 2009
Sold by
Alsop Mary J
Bought by
Alsop Timothy A and Alsop Mary J
Purchase Details
Closed on
Jan 24, 2008
Sold by
Henderlight Charlotte L
Bought by
Alsop Mary J
Create a Home Valuation Report for This Property
The Home Valuation Report is an in-depth analysis detailing your home's value as well as a comparison with similar homes in the area
Home Values in the Area
Average Home Value in this Area
Purchase History
| Date | Buyer | Sale Price | Title Company |
|---|---|---|---|
| Forntier Holdings Llc | -- | Land Title Guarantee Co | |
| Frontier Properties Llc | $131,000 | Land Title Guarantee Co | |
| Alsop Timothy A | -- | None Available | |
| Alsop Mary J | -- | None Available |
Source: Public Records
Tax History Compared to Growth
Tax History
| Year | Tax Paid | Tax Assessment Tax Assessment Total Assessment is a certain percentage of the fair market value that is determined by local assessors to be the total taxable value of land and additions on the property. | Land | Improvement |
|---|---|---|---|---|
| 2024 | $2,512 | $23,500 | $5,000 | $18,500 |
| 2023 | $2,552 | $27,670 | $5,210 | $22,460 |
| 2022 | $2,367 | $20,830 | $5,350 | $15,480 |
| 2021 | $2,466 | $20,830 | $5,350 | $15,480 |
| 2020 | $2,517 | $21,330 | $5,510 | $15,820 |
| 2019 | $2,513 | $21,330 | $5,510 | $15,820 |
| 2018 | $1,893 | $16,000 | $4,320 | $11,680 |
| 2017 | $1,682 | $16,000 | $4,320 | $11,680 |
| 2016 | $1,447 | $13,660 | $2,390 | $11,270 |
| 2015 | $1,402 | $13,660 | $2,390 | $11,270 |
| 2014 | $1,208 | $11,590 | $2,390 | $9,200 |
Source: Public Records
Map
Nearby Homes
- 11185 E 25th Ave
- 2391 Kingston St
- 11120 E 26th Ave
- 11059 E 25th Dr
- 11336 E 27th Ave
- 2521 Moline St
- 10950 E 26th Ave
- 2350 Joliet St
- 11589 E 25th Dr
- 2861 Lima St
- 2045 Lima St
- 2572 Iola St
- 11087 E Montview Blvd
- 11087 Montview Blvd
- 2241 Ironton St
- 2064 Ironton St
- 2340 Oswego St
- 1967 Macon St
- 1990 Newark St
- 1902 Kenton St
- 2380 Lansing St
- 2370 Lansing St
- 11235 E 25th Ave
- 2381 Lima St
- 2391 Lima St
- 11227 E 25th Ave
- 2360 Lansing St
- 11225 E 25th Ave
- 2381 Lansing St
- 11175 E 25th Ave
- 2371 Lima St
- 11237 E 25th Ave
- 11177 E 25th Ave
- 2371 Lansing St
- 11245 E 25th Ave
- 11217 E 25th Ave
- 2371 N Lima St
- 2361 Lima St
- 11187 E 25th Ave
- 11275 E 25th Ave