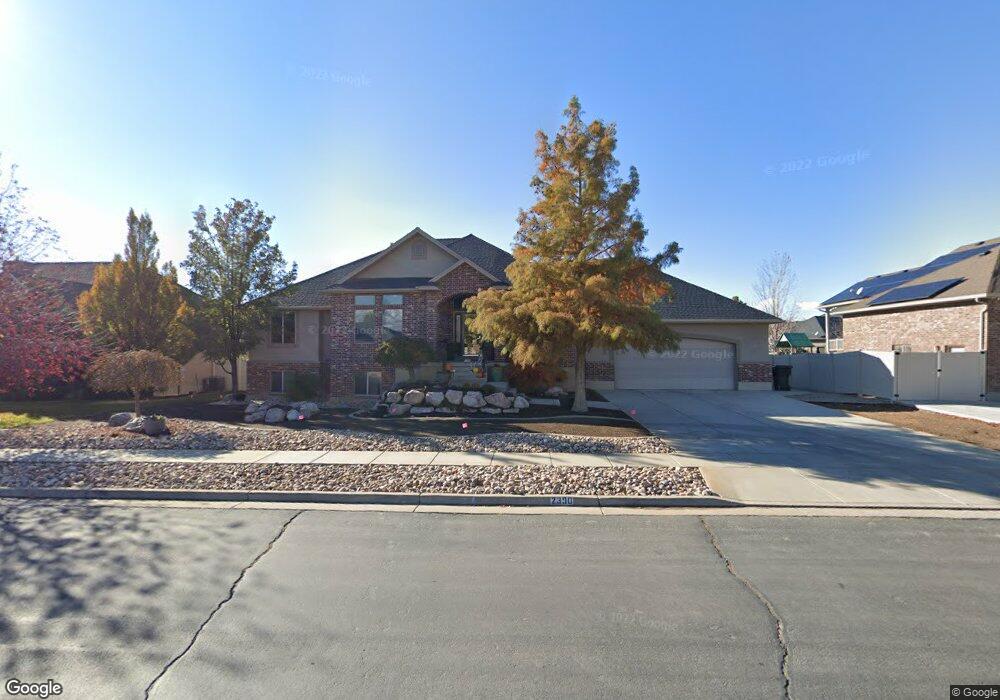
2390 S 2050 W Syracuse, UT 84075
Estimated Value: $728,000 - $754,000
6
Beds
3
Baths
4,034
Sq Ft
$184/Sq Ft
Est. Value
About This Home
This home is located at 2390 S 2050 W, Syracuse, UT 84075 and is currently estimated at $740,909, approximately $183 per square foot. 2390 S 2050 W is a home located in Davis County with nearby schools including Syracuse Elementary School, Syracuse Junior High School, and Syracuse High School.
Ownership History
Date
Name
Owned For
Owner Type
Purchase Details
Closed on
Mar 28, 2012
Sold by
Meyer Ritchie W and Meyer Susan D
Bought by
Green Michael J and Green Amy M
Current Estimated Value
Home Financials for this Owner
Home Financials are based on the most recent Mortgage that was taken out on this home.
Original Mortgage
$315,675
Outstanding Balance
$129,376
Interest Rate
3.75%
Mortgage Type
FHA
Estimated Equity
$611,533
Purchase Details
Closed on
Apr 16, 2010
Sold by
Isaksen Jeff and Isaksen Jamie
Bought by
Meyer Ritchie W and Meyer Susan D
Purchase Details
Closed on
Apr 29, 2005
Sold by
Coldwater I Lc
Bought by
Isaksen Jeff and Isaksen Jamie
Home Financials for this Owner
Home Financials are based on the most recent Mortgage that was taken out on this home.
Original Mortgage
$16,060
Interest Rate
5.56%
Mortgage Type
Future Advance Clause Open End Mortgage
Create a Home Valuation Report for This Property
The Home Valuation Report is an in-depth analysis detailing your home's value as well as a comparison with similar homes in the area
Home Values in the Area
Average Home Value in this Area
Purchase History
| Date | Buyer | Sale Price | Title Company |
|---|---|---|---|
| Green Michael J | -- | Backman Title Servic | |
| Meyer Ritchie W | $272,000 | None Available | |
| Isaksen Jeff | -- | Bonneville Title Co |
Source: Public Records
Mortgage History
| Date | Status | Borrower | Loan Amount |
|---|---|---|---|
| Open | Green Michael J | $315,675 | |
| Previous Owner | Isaksen Jeff | $16,060 | |
| Previous Owner | Isaksen Jeff | $256,973 |
Source: Public Records
Tax History Compared to Growth
Tax History
| Year | Tax Paid | Tax Assessment Tax Assessment Total Assessment is a certain percentage of the fair market value that is determined by local assessors to be the total taxable value of land and additions on the property. | Land | Improvement |
|---|---|---|---|---|
| 2025 | $4,036 | $389,400 | $129,511 | $259,889 |
| 2024 | $3,998 | $388,300 | $111,603 | $276,697 |
| 2023 | $3,752 | $664,000 | $155,244 | $508,756 |
| 2022 | $3,996 | $387,750 | $88,738 | $299,012 |
| 2021 | $3,455 | $519,000 | $131,653 | $387,347 |
| 2020 | $3,081 | $448,000 | $112,417 | $335,583 |
| 2019 | $3,030 | $435,000 | $112,661 | $322,339 |
| 2018 | $2,814 | $401,000 | $107,305 | $293,695 |
| 2016 | $2,607 | $194,810 | $41,084 | $153,726 |
| 2015 | $2,873 | $204,435 | $41,084 | $163,351 |
| 2014 | $2,577 | $186,923 | $41,084 | $145,839 |
| 2013 | -- | $165,293 | $34,786 | $130,507 |
Source: Public Records
Map
Nearby Homes
- 2104 W 2200 S
- 1836 W 2400 S
- 2503 S 1875 W
- 2208 W 2615 S Unit 141
- 2198 W 2615 S Unit 140
- 2158 W 2615 S Unit 137
- 2136 W 2200 S
- 2650 S 2000 W
- 2194 S 1800 W
- 2297 W 2175 S
- 2047 S 2000 W
- 2402 W 2700 S
- 2082 S 1730 W
- Bridgeport Plan at Sadie's Glenn
- Sullivan Plan at Sadie's Glenn
- Ashmore Plan at Sadie's Glenn
- Havenwood Plan at Sadie's Glenn
- Bradford Plan at Sadie's Glenn
- Sadie's Glen Plan at Sadie's Glenn
- Hamilton Plan at Sadie's Glenn