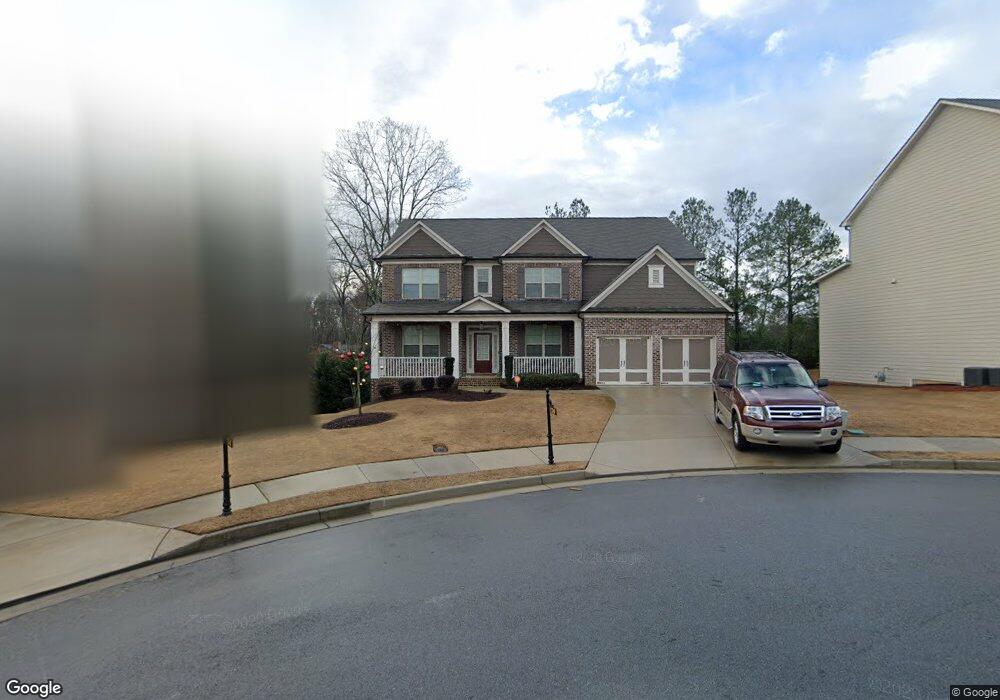
2390 Wildlife Ct Unit 12 Buford, GA 30519
Estimated Value: $474,000 - $705,000
5
Beds
5
Baths
3,681
Sq Ft
$173/Sq Ft
Est. Value
About This Home
This home is located at 2390 Wildlife Ct Unit 12, Buford, GA 30519 and is currently estimated at $635,329, approximately $172 per square foot. 2390 Wildlife Ct Unit 12 is a home located in Gwinnett County with nearby schools including Patrick Elementary School and Glenn C. Jones Middle School.
Ownership History
Date
Name
Owned For
Owner Type
Purchase Details
Closed on
Feb 9, 2024
Sold by
Hyman Carol M
Bought by
Savaliya Kevin and Shiroya Srushti
Current Estimated Value
Home Financials for this Owner
Home Financials are based on the most recent Mortgage that was taken out on this home.
Original Mortgage
$532,000
Outstanding Balance
$522,686
Interest Rate
6.66%
Mortgage Type
New Conventional
Estimated Equity
$112,643
Purchase Details
Closed on
Sep 21, 2016
Sold by
Hb Holdings Grp Llc
Bought by
Hyman Carol
Home Financials for this Owner
Home Financials are based on the most recent Mortgage that was taken out on this home.
Original Mortgage
$357,000
Interest Rate
3.43%
Mortgage Type
New Conventional
Purchase Details
Closed on
Jul 19, 2016
Sold by
Hsc Meadows Llc
Bought by
Hyman Carol
Create a Home Valuation Report for This Property
The Home Valuation Report is an in-depth analysis detailing your home's value as well as a comparison with similar homes in the area
Home Values in the Area
Average Home Value in this Area
Purchase History
| Date | Buyer | Sale Price | Title Company |
|---|---|---|---|
| Savaliya Kevin | $665,000 | -- | |
| Hyman Carol | -- | -- | |
| Hyman Carol | $409,900 | -- |
Source: Public Records
Mortgage History
| Date | Status | Borrower | Loan Amount |
|---|---|---|---|
| Open | Savaliya Kevin | $532,000 | |
| Previous Owner | Hyman Carol | $357,000 |
Source: Public Records
Tax History Compared to Growth
Tax History
| Year | Tax Paid | Tax Assessment Tax Assessment Total Assessment is a certain percentage of the fair market value that is determined by local assessors to be the total taxable value of land and additions on the property. | Land | Improvement |
|---|---|---|---|---|
| 2024 | $6,976 | $192,640 | $32,000 | $160,640 |
| 2023 | $6,976 | $192,640 | $32,000 | $160,640 |
| 2022 | $6,945 | $192,640 | $32,000 | $160,640 |
| 2021 | $7,260 | $192,640 | $32,000 | $160,640 |
| 2020 | $7,305 | $192,640 | $32,000 | $160,640 |
| 2019 | $6,031 | $163,960 | $32,000 | $131,960 |
| 2018 | $6,044 | $163,960 | $32,000 | $131,960 |
| 2016 | $6,353 | $174,240 | $32,000 | $142,240 |
| 2015 | $1,042 | $28,800 | $28,800 | $0 |
Source: Public Records
Map
Nearby Homes
- 2452 Kilgore Rd
- 2395 Kilgore Rd
- 3568 Foxworth Ct
- 2550 Kilgore Rd
- 2551 Kilgore Rd
- 2372 Wood Beil Ct
- 3123 Walkers Falls Way
- The Aspen A Plan at Fern Hollow
- The Hickory F Plan at Fern Hollow
- The Danbury J Plan at Fern Hollow
- 2330 Chandler Grove Dr
- 3302 Anna Ruby Ln
- 2581 Trailing Ivy Way
- 2372 Walkers Glen Ln
- 2381 Walkers Glen Ln Unit 2C
- 2272 Misty Brook Ct
- 3669 Brockenhurst Dr
- 2718 Kilgore Rd
- 2687 Black Fox Ct
- 2710 Kilgore Rd
- 2390 Wildlife Ct
- 2400 Wildlife Ct
- 0 Wildlife Ct Unit 8595555
- 0 Wildlife Ct Unit 8503921
- 0 Wildlife Ct Unit 8240023
- 0 Wildlife Ct Unit 8196496
- 0 Wildlife Ct Unit 8167991
- 0 Wildlife Ct Unit 8167977
- 0 Wildlife Ct Unit 8138901
- 0 Wildlife Ct Unit 8074995
- 0 Wildlife Ct Unit 8017843
- 0 Wildlife Ct Unit 8435845
- 0 Wildlife Ct Unit 8613953
- 0 Wildlife Ct Unit 8554631
- 0 Wildlife Ct Unit 8168048
- 0 Wildlife Ct Unit 8168029
- 0 Wildlife Ct Unit 8106708
- 0 Wildlife Ct Unit 8106258
- 0 Wildlife Ct Unit 8106256
- 0 Wildlife Ct Unit 8004545