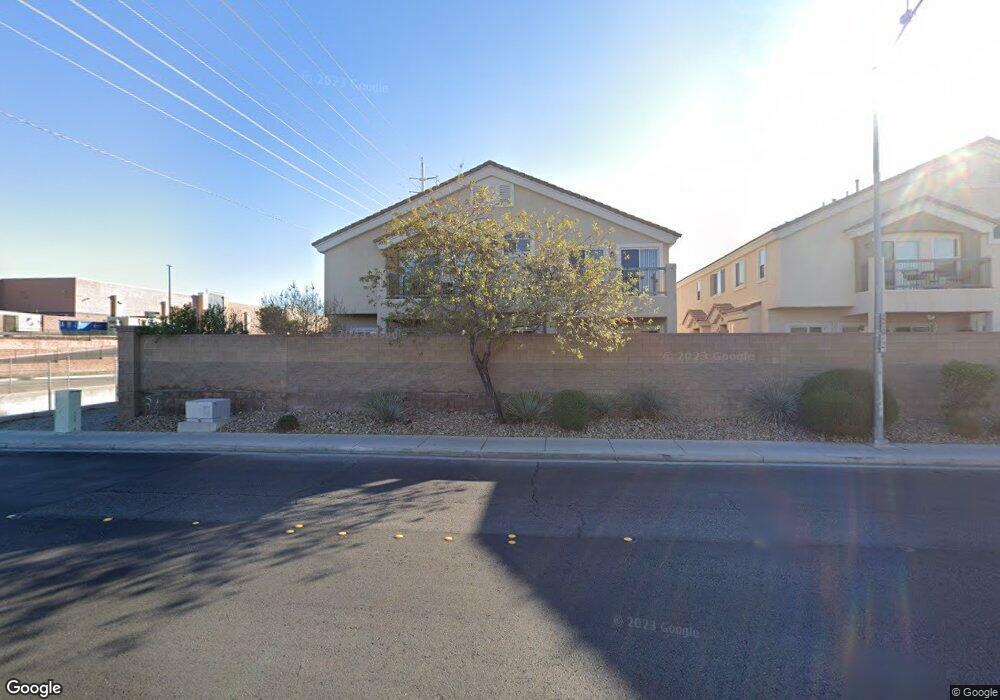
2390 Yellowstn Crk Dr Unit 102 Las Vegas, NV 89183
Silverado Ranch NeighborhoodEstimated Value: $364,271 - $383,000
2
Beds
3
Baths
1,423
Sq Ft
$260/Sq Ft
Est. Value
About This Home
This home is located at 2390 Yellowstn Crk Dr Unit 102, Las Vegas, NV 89183 and is currently estimated at $370,568, approximately $260 per square foot. 2390 Yellowstn Crk Dr Unit 102 is a home located in Clark County with nearby schools including Shirley A Barber Elementary, Charles Silvestri Junior High School, and Liberty High School.
Ownership History
Date
Name
Owned For
Owner Type
Purchase Details
Closed on
Feb 6, 2018
Sold by
Klontz Stephen F and Klontz Terri L
Bought by
Klontz Stephen F and Klontz Terri L
Current Estimated Value
Purchase Details
Closed on
Oct 8, 2013
Sold by
Custom Estates Llc
Bought by
Klontz Stephen F and Klontz Terri L
Home Financials for this Owner
Home Financials are based on the most recent Mortgage that was taken out on this home.
Original Mortgage
$128,000
Outstanding Balance
$96,369
Interest Rate
4.55%
Mortgage Type
New Conventional
Estimated Equity
$274,199
Purchase Details
Closed on
Jun 26, 2013
Sold by
Taylor Stefan C
Bought by
Custom Estates Llc
Purchase Details
Closed on
Feb 29, 2008
Sold by
D R Horton Inc
Bought by
Taylor Stefan C
Home Financials for this Owner
Home Financials are based on the most recent Mortgage that was taken out on this home.
Original Mortgage
$233,307
Interest Rate
5.72%
Mortgage Type
FHA
Create a Home Valuation Report for This Property
The Home Valuation Report is an in-depth analysis detailing your home's value as well as a comparison with similar homes in the area
Home Values in the Area
Average Home Value in this Area
Purchase History
| Date | Buyer | Sale Price | Title Company |
|---|---|---|---|
| Klontz Stephen F | -- | None Available | |
| Klontz Stephen F | $162,500 | Ticor Title Las Vegas | |
| Custom Estates Llc | $125,000 | Chicago Title Las Vegas | |
| Taylor Stefan C | $236,970 | Dhi Title |
Source: Public Records
Mortgage History
| Date | Status | Borrower | Loan Amount |
|---|---|---|---|
| Open | Klontz Stephen F | $128,000 | |
| Previous Owner | Taylor Stefan C | $233,307 |
Source: Public Records
Tax History Compared to Growth
Tax History
| Year | Tax Paid | Tax Assessment Tax Assessment Total Assessment is a certain percentage of the fair market value that is determined by local assessors to be the total taxable value of land and additions on the property. | Land | Improvement |
|---|---|---|---|---|
| 2025 | $1,602 | $95,042 | $33,180 | $61,862 |
| 2024 | $1,556 | $95,042 | $33,180 | $61,862 |
| 2023 | $1,556 | $90,535 | $34,563 | $55,972 |
| 2022 | $1,511 | $76,204 | $23,188 | $53,016 |
| 2021 | $1,467 | $64,993 | $21,875 | $43,118 |
| 2020 | $1,421 | $66,738 | $21,875 | $44,863 |
| 2019 | $1,379 | $66,269 | $21,875 | $44,394 |
| 2018 | $1,339 | $59,828 | $17,500 | $42,328 |
| 2017 | $1,648 | $55,772 | $14,000 | $41,772 |
| 2016 | $1,269 | $50,800 | $9,625 | $41,175 |
| 2015 | $1,265 | $49,004 | $8,750 | $40,254 |
| 2014 | $1,228 | $40,213 | $7,000 | $33,213 |
Source: Public Records
Map
Nearby Homes
- 9994 Government Point Way Unit 101
- 10062 Aspen Rose St Unit 103
- 2295 Koho Dr Unit 101
- 448 Temple Canyon Place
- 451 Rumford Place
- 2013 Spiers Ave
- 9851 Silver Dew St
- 10034 Candle Maker St
- 427 Rhythm St
- 2300 E Silverado Ranch Blvd Unit 2112
- 2300 E Silverado Ranch Blvd Unit 2033
- 2300 E Silverado Ranch Blvd Unit 2161
- 2300 E Silverado Ranch Blvd Unit 1080
- 2300 E Silverado Ranch Blvd Unit 1106
- 2300 E Silverado Ranch Blvd Unit 2196
- 2300 E Silverado Ranch Blvd Unit 2158
- 2300 E Silverado Ranch Blvd Unit 1074
- 2300 E Silverado Ranch Blvd Unit 1180
- 2300 E Silverado Ranch Blvd Unit 1104
- 2300 E Silverado Ranch Blvd Unit 2133
- 2390 Yellowstn Crk Dr Unit 103
- 2390 Yellowstn Crk Dr Unit 101
- 2390 Yellowstone Creek Dr Unit 101
- 2390 Yellowstone Creek Dr Unit 103
- 2390 Yellowstone Creek Dr Unit 102
- 2376 Yellowstone Creek Dr Unit 103
- 2376 Yellowstone Creek Dr Unit 101
- 2376 Yellowstn Crk Dr Unit 103
- 2376 Yellowstn Crk Dr Unit 102
- 2376 Yellowstn Crk Dr Unit 101
- 9969 Diamond Summit Ct Unit 101
- 9969 Diamond Summit Ct Unit 103
- 9969 Diamond Summit Ct Unit 102
- 2362 Yellowstone Creek Dr Unit 103
- 2362 Yellowstone Creek Dr Unit 102
- 2362 Yellowstone Creek Dr Unit 101
- 2362 Yellowstn Crk Dr Unit 103
- 2362 Yellowstn Crk Dr Unit 101
- 2362 Yellowstn Crk Dr Unit 102
- 9983 Diamond Summit Ct Unit 101