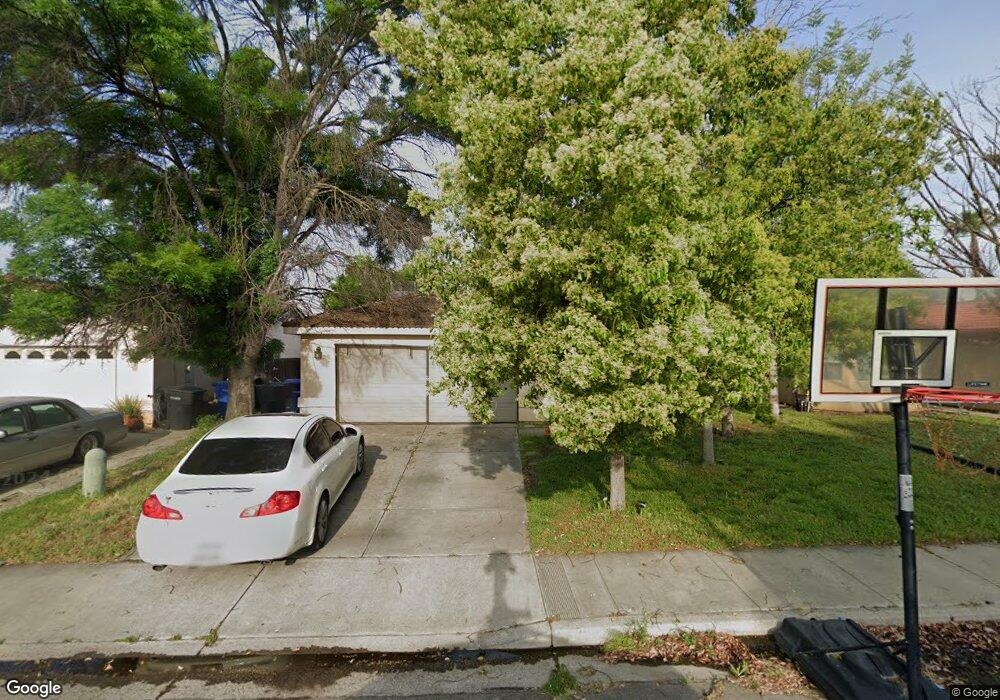
2390 Zion Way Hanford, CA 93230
Estimated Value: $336,887 - $383,000
3
Beds
2
Baths
1,480
Sq Ft
$240/Sq Ft
Est. Value
About This Home
This home is located at 2390 Zion Way, Hanford, CA 93230 and is currently estimated at $355,472, approximately $240 per square foot. 2390 Zion Way is a home located in Kings County with nearby schools including Monroe Elementary School, Woodrow Wilson Junior High School, and Hanford West High School.
Ownership History
Date
Name
Owned For
Owner Type
Purchase Details
Closed on
Dec 4, 2002
Sold by
Better Built Homes Inc
Bought by
Ash Aaron C
Current Estimated Value
Home Financials for this Owner
Home Financials are based on the most recent Mortgage that was taken out on this home.
Original Mortgage
$139,562
Interest Rate
5.97%
Purchase Details
Closed on
Nov 21, 2002
Sold by
Venturella D W and Venturella Linda
Bought by
Better Built Homes Inc
Home Financials for this Owner
Home Financials are based on the most recent Mortgage that was taken out on this home.
Original Mortgage
$139,562
Interest Rate
5.97%
Purchase Details
Closed on
Nov 20, 2001
Sold by
Better Built Homes Inc
Bought by
Venturella D W and Venturella Linda
Home Financials for this Owner
Home Financials are based on the most recent Mortgage that was taken out on this home.
Original Mortgage
$105,400
Interest Rate
6.57%
Purchase Details
Closed on
Jan 9, 2001
Sold by
Cielo Investment Group Inc
Bought by
Better Built Homes Inc
Home Financials for this Owner
Home Financials are based on the most recent Mortgage that was taken out on this home.
Original Mortgage
$95,000
Interest Rate
7.65%
Create a Home Valuation Report for This Property
The Home Valuation Report is an in-depth analysis detailing your home's value as well as a comparison with similar homes in the area
Home Values in the Area
Average Home Value in this Area
Purchase History
| Date | Buyer | Sale Price | Title Company |
|---|---|---|---|
| Ash Aaron C | $137,500 | Chicago Title Company | |
| Better Built Homes Inc | -- | Chicago Title Company | |
| Venturella D W | -- | Chicago Title Co | |
| Better Built Homes Inc | $28,000 | Chicago Title Co |
Source: Public Records
Mortgage History
| Date | Status | Borrower | Loan Amount |
|---|---|---|---|
| Previous Owner | Ash Aaron C | $139,562 | |
| Previous Owner | Venturella D W | $105,400 | |
| Previous Owner | Better Built Homes Inc | $95,000 | |
| Closed | Better Built Homes Inc | $7,000 |
Source: Public Records
Tax History Compared to Growth
Tax History
| Year | Tax Paid | Tax Assessment Tax Assessment Total Assessment is a certain percentage of the fair market value that is determined by local assessors to be the total taxable value of land and additions on the property. | Land | Improvement |
|---|---|---|---|---|
| 2025 | $2,142 | $199,142 | $43,447 | $155,695 |
| 2023 | $2,142 | $191,411 | $41,761 | $149,650 |
| 2022 | $2,098 | $187,659 | $40,943 | $146,716 |
| 2021 | $2,054 | $183,981 | $40,141 | $143,840 |
| 2020 | $2,075 | $182,094 | $39,729 | $142,365 |
| 2019 | $2,041 | $178,524 | $38,950 | $139,574 |
| 2018 | $1,983 | $175,023 | $38,186 | $136,837 |
| 2017 | $1,954 | $171,591 | $37,437 | $134,154 |
| 2016 | $1,928 | $168,227 | $36,703 | $131,524 |
| 2015 | $1,916 | $165,700 | $36,152 | $129,548 |
| 2014 | $1,880 | $162,454 | $35,444 | $127,010 |
Source: Public Records
Map
Nearby Homes
- 1128 W Orange St
- 1374 Semillon St
- 850 Northstar Dr
- 1384 W Bella Oaks Way
- 2127 N 11th Ave
- 710 Northstar Dr
- 1366 Muscat Ct
- 496 W Earl Way
- 1411 Bella Oaks Way
- 1365 Muscat Ct
- 795 Laurence Ln
- 2821 Stonecrest Way
- 2352 Cabrillo Way
- 1093 Raymond Rd
- 2612 Aspen St
- 314 W Birch Ave
- 1551 N Mitchell St
- 1527 N Mitchell St