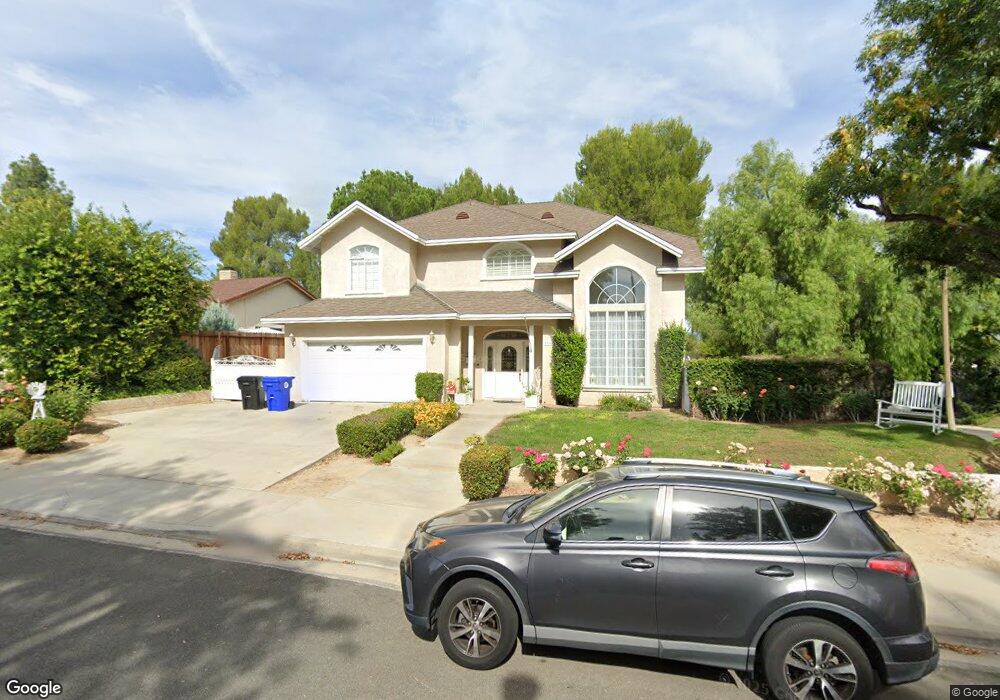
23903 Via Hamaca Valencia, CA 91355
Estimated Value: $1,044,502 - $1,295,000
5
Beds
3
Baths
3,036
Sq Ft
$370/Sq Ft
Est. Value
About This Home
This home is located at 23903 Via Hamaca, Valencia, CA 91355 and is currently estimated at $1,121,876, approximately $369 per square foot. 23903 Via Hamaca is a home located in Los Angeles County with nearby schools including Old Orchard Elementary School, Placerita Junior High School, and William S. Hart High School.
Ownership History
Date
Name
Owned For
Owner Type
Purchase Details
Closed on
Mar 1, 2019
Sold by
Bradley Steve L
Bought by
Bradley Esphy R
Current Estimated Value
Home Financials for this Owner
Home Financials are based on the most recent Mortgage that was taken out on this home.
Original Mortgage
$215,000
Outstanding Balance
$187,458
Interest Rate
4%
Mortgage Type
New Conventional
Estimated Equity
$934,418
Purchase Details
Closed on
May 24, 1997
Sold by
Ostayan Sam
Bought by
Bradley Steve L and Bradley Esphy
Home Financials for this Owner
Home Financials are based on the most recent Mortgage that was taken out on this home.
Original Mortgage
$10,000
Interest Rate
8.13%
Mortgage Type
Seller Take Back
Purchase Details
Closed on
Aug 6, 1996
Sold by
Eastman Lawrence A and Eastman Cathy L
Bought by
Ostayan Sam
Create a Home Valuation Report for This Property
The Home Valuation Report is an in-depth analysis detailing your home's value as well as a comparison with similar homes in the area
Home Values in the Area
Average Home Value in this Area
Purchase History
| Date | Buyer | Sale Price | Title Company |
|---|---|---|---|
| Bradley Esphy R | -- | Provident Title Company | |
| Bradley Steve L | $47,000 | Continental Lawyers Title Co | |
| Ostayan Sam | $12,000 | Chicago Title Company |
Source: Public Records
Mortgage History
| Date | Status | Borrower | Loan Amount |
|---|---|---|---|
| Open | Bradley Esphy R | $215,000 | |
| Closed | Bradley Steve L | $10,000 |
Source: Public Records
Tax History
| Year | Tax Paid | Tax Assessment Tax Assessment Total Assessment is a certain percentage of the fair market value that is determined by local assessors to be the total taxable value of land and additions on the property. | Land | Improvement |
|---|---|---|---|---|
| 2025 | $5,614 | $359,943 | $76,536 | $283,407 |
| 2024 | $5,614 | $352,886 | $75,036 | $277,850 |
| 2023 | $5,445 | $345,967 | $73,565 | $272,402 |
| 2022 | $5,354 | $339,184 | $72,123 | $267,061 |
| 2021 | $5,240 | $332,534 | $70,709 | $261,825 |
| 2019 | $5,071 | $322,672 | $68,612 | $254,060 |
| 2018 | $4,878 | $316,346 | $67,267 | $249,079 |
| 2016 | $4,677 | $304,064 | $64,656 | $239,408 |
| 2015 | $4,588 | $299,497 | $63,685 | $235,812 |
| 2014 | $4,516 | $293,631 | $62,438 | $231,193 |
Source: Public Records
Map
Nearby Homes
- 23943 Via Flamenco
- 25442 Via Escovar
- 25426 Avenida Escalera
- 25636 Ailean Ct
- 23814 Sarda Rd
- 25550 Old Course Way
- 25729 Tournament Rd
- 24241 Lema Dr
- 23627 Via Delos
- 25573 Via Paladar
- 25790 Parada Dr
- 25668 Fedala Rd
- 24086 Avenida Crescenta
- 24430 Nicklaus Dr Unit L2
- 25736 Player Dr Unit R4
- 25459 Cariz Dr
- 23545 Via Decano
- 23503 Via Decano
- 23509 Via Chantilly
- 25377 Fortuna Dr
- 23913 Via Hamaca
- 23919 Via Hamaca
- 25534 Avenida Escalera
- 23902 Via Hamaca
- 25528 Avenida Escalera
- 23910 Via Hamaca
- 25520 Avenida Escalera
- 24014 Oak Vale Dr
- 23918 Via Hamaca
- 25514 Avenida Escalera
- 23960 Sarda Rd
- 23927 Via Hamaca
- 24008 Oak Vale Dr
- 23905 Plaza Gavilan
- 23911 Plaza Gavilan
- 23926 Via Hamaca
- 23954 Sarda Rd
- 25506 Avenida Escalera
- 23917 Plaza Gavilan
- 25435 Via Adorna
Your Personal Tour Guide
Ask me questions while you tour the home.