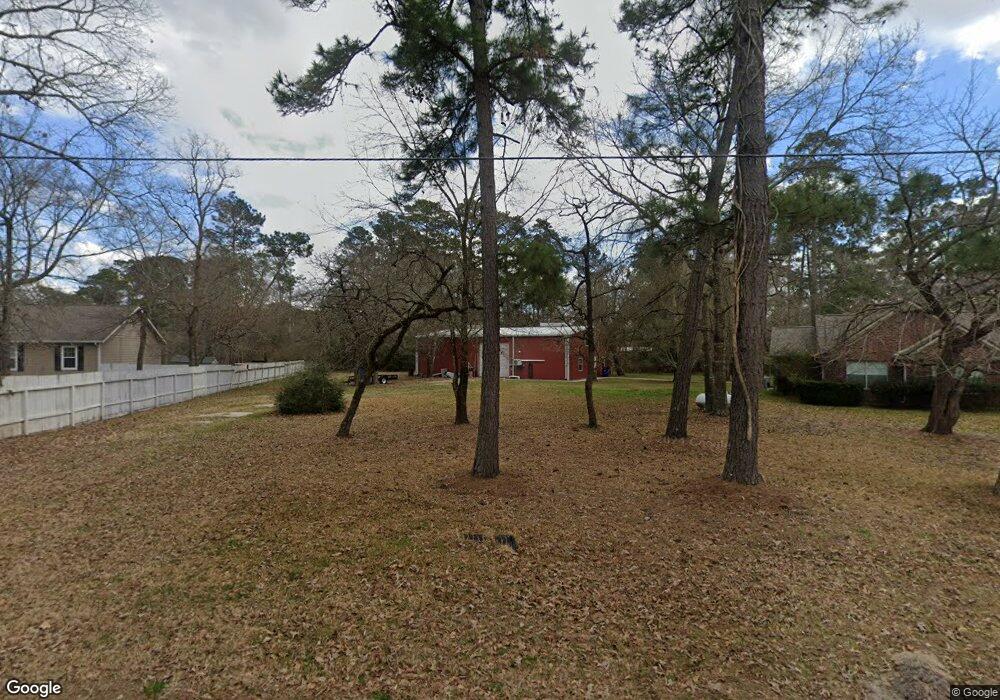
23904 Crooked Creek Hockley, TX 77447
Clear Creek Forest NeighborhoodEstimated Value: $310,000 - $434,000
3
Beds
2
Baths
1,392
Sq Ft
$257/Sq Ft
Est. Value
About This Home
This home is located at 23904 Crooked Creek, Hockley, TX 77447 and is currently estimated at $357,203, approximately $256 per square foot. 23904 Crooked Creek is a home located in Montgomery County with nearby schools including J.L. Lyon Elementary School, Magnolia Sixth Grade Campus, and Magnolia Junior High School.
Ownership History
Date
Name
Owned For
Owner Type
Purchase Details
Closed on
Feb 1, 2012
Sold by
Montgomery Capital
Bought by
Belaschky Joseph
Current Estimated Value
Home Financials for this Owner
Home Financials are based on the most recent Mortgage that was taken out on this home.
Original Mortgage
$162,766
Outstanding Balance
$114,200
Interest Rate
4.4%
Mortgage Type
FHA
Estimated Equity
$243,003
Purchase Details
Closed on
May 2, 2006
Sold by
Scholl Margie L
Bought by
Belaschky Joseph
Purchase Details
Closed on
Sep 11, 1997
Sold by
Elmblad Scott and Elmblad Roxanne
Bought by
Scholl Margie L
Home Financials for this Owner
Home Financials are based on the most recent Mortgage that was taken out on this home.
Original Mortgage
$80,350
Interest Rate
7.48%
Create a Home Valuation Report for This Property
The Home Valuation Report is an in-depth analysis detailing your home's value as well as a comparison with similar homes in the area
Home Values in the Area
Average Home Value in this Area
Purchase History
| Date | Buyer | Sale Price | Title Company |
|---|---|---|---|
| Belaschky Joseph | -- | Mctc | |
| Belaschky Joseph | -- | -- | |
| Montgomery Capital | $75,650 | None Available | |
| Scholl Margie L | -- | American Title Company |
Source: Public Records
Mortgage History
| Date | Status | Borrower | Loan Amount |
|---|---|---|---|
| Open | Belaschky Joseph | $162,766 | |
| Previous Owner | Scholl Margie L | $80,350 |
Source: Public Records
Tax History Compared to Growth
Tax History
| Year | Tax Paid | Tax Assessment Tax Assessment Total Assessment is a certain percentage of the fair market value that is determined by local assessors to be the total taxable value of land and additions on the property. | Land | Improvement |
|---|---|---|---|---|
| 2025 | $2,498 | $255,447 | -- | -- |
| 2024 | $2,232 | $232,225 | $64,071 | $168,154 |
| 2023 | $2,232 | $215,040 | $64,070 | $175,760 |
| 2022 | $3,450 | $195,490 | $55,360 | $176,150 |
| 2021 | $3,303 | $177,720 | $41,000 | $136,720 |
| 2020 | $3,514 | $173,640 | $41,000 | $132,640 |
| 2019 | $3,396 | $168,610 | $41,000 | $127,610 |
| 2018 | $3,224 | $152,530 | $24,090 | $128,440 |
| 2017 | $3,252 | $153,350 | $24,090 | $129,260 |
| 2016 | $3,331 | $157,090 | $24,090 | $133,000 |
| 2015 | $2,592 | $122,900 | $24,090 | $98,810 |
| 2014 | $2,592 | $120,860 | $12,030 | $108,830 |
Source: Public Records
Map
Nearby Homes
- 23615 Roberts Cemetery Rd
- 23215 Nichols Sawmill Rd
- 23711 Saxon Way
- 23719 Saxon Way
- 21405 Roberts Cemetery Rd
- 23602 Kings Forest Rd
- 23702 Brushy Oaks St
- 24445 Pipestem Dr
- 21802 Lindheimer Rd
- 22940 Nichols Sawmill Rd
- 2512 Harper Cliff Ct
- 0 Baneberry
- 21701 Glenmont Blvd
- 2407 Emerie Arbor Ln
- 2302 Iris Cove Ct
- 000 Bergman Dr
- 289 Pelican St
- 25308 Brushby Creek Dr
- 25304 Brushby Creek Dr
- 25340 Brushby Creek Dr
- 23904 Crooked Creek
- 23906 Crooked Creek
- 23310 Roberts Cemetery Rd
- 23910 Crooked Creek
- 23903 Crooked Creek
- 23403 Roberts Cemetery Rd
- 23306 Roberts Cemetery Rd
- 23407 Roberts Cemetery Rd
- 23911 Crooked Creek
- 23911 Crooked Creek
- 23414 Roberts Cemetery Rd
- 23218 Roberts Cemetery Rd
- 23307 Roberts Cemetery Rd
- 23501 Roberts Cemetery Rd
- 23912 Crooked Creek
- 23918 Crooked Creek
- 23503 Roberts Cemetery Rd
- 23230 Roberts Cemetery Rd
- 23506 Roberts Cemetery Rd
- 23206 Forest Ct