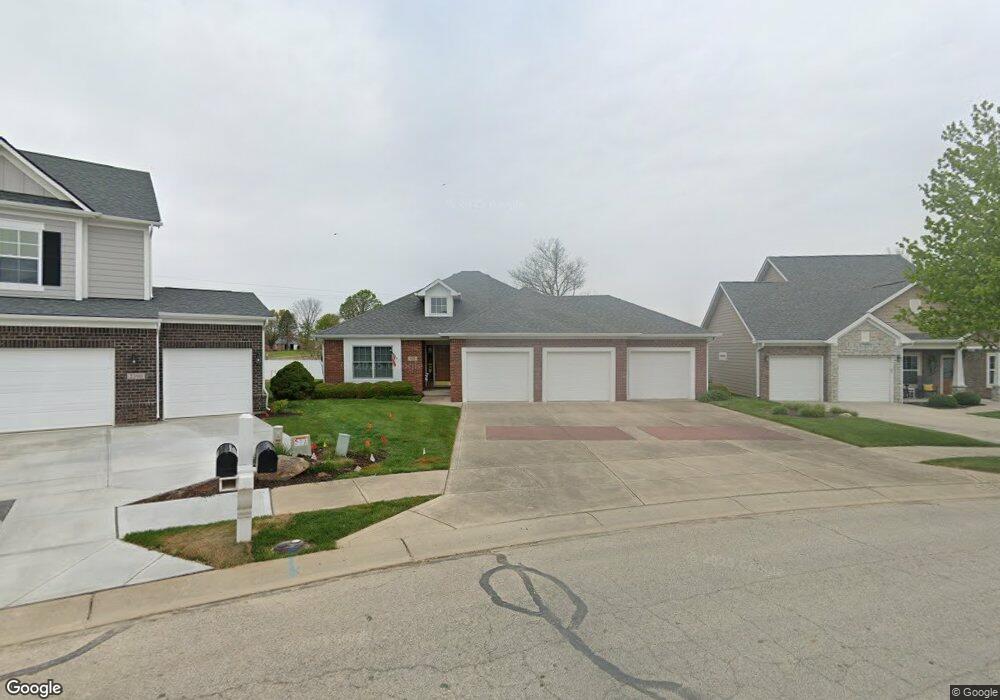
2392 Somerset Cir Franklin, IN 46131
Estimated Value: $355,334 - $388,000
4
Beds
3
Baths
1,593
Sq Ft
$233/Sq Ft
Est. Value
About This Home
This home is located at 2392 Somerset Cir, Franklin, IN 46131 and is currently estimated at $371,584, approximately $233 per square foot. 2392 Somerset Cir is a home located in Johnson County with nearby schools including Needham Elementary School, Franklin Community Middle School, and Custer Baker Intermediate School.
Ownership History
Date
Name
Owned For
Owner Type
Purchase Details
Closed on
Jul 25, 2024
Sold by
Andrews Neal R
Bought by
Andrews Neal R and Andrews Lara M
Current Estimated Value
Purchase Details
Closed on
Jan 19, 2024
Sold by
Andrews Edward C
Bought by
Andrews Neal R
Purchase Details
Closed on
Oct 5, 2016
Sold by
The Edward C And Gloria J Andrews Keysto
Bought by
Andrews Edward C
Purchase Details
Closed on
Dec 23, 2014
Sold by
Andrews Edward C and Andrews Gloria J
Bought by
Edward C And Gloria J Andrews Keystone T
Create a Home Valuation Report for This Property
The Home Valuation Report is an in-depth analysis detailing your home's value as well as a comparison with similar homes in the area
Home Values in the Area
Average Home Value in this Area
Purchase History
| Date | Buyer | Sale Price | Title Company |
|---|---|---|---|
| Andrews Neal R | -- | None Listed On Document | |
| Andrews Neal R | -- | None Listed On Document | |
| Andrews Edward C | -- | None Available | |
| Edward C And Gloria J Andrews Keystone T | -- | None Available |
Source: Public Records
Tax History Compared to Growth
Tax History
| Year | Tax Paid | Tax Assessment Tax Assessment Total Assessment is a certain percentage of the fair market value that is determined by local assessors to be the total taxable value of land and additions on the property. | Land | Improvement |
|---|---|---|---|---|
| 2025 | $3,761 | $342,800 | $49,000 | $293,800 |
| 2024 | $3,761 | $337,700 | $49,000 | $288,700 |
| 2023 | $3,768 | $337,700 | $49,000 | $288,700 |
| 2022 | $3,777 | $334,400 | $49,000 | $285,400 |
| 2021 | $5,430 | $243,500 | $37,200 | $206,300 |
| 2020 | $5,249 | $235,400 | $37,200 | $198,200 |
| 2019 | $5,356 | $240,200 | $37,200 | $203,000 |
| 2018 | $3,822 | $202,800 | $37,200 | $165,600 |
| 2017 | $3,578 | $178,400 | $37,200 | $141,200 |
| 2016 | $3,568 | $178,400 | $37,200 | $141,200 |
| 2014 | $3,568 | $178,400 | $41,800 | $136,600 |
| 2013 | $3,568 | $195,900 | $41,800 | $154,100 |
Source: Public Records
Map
Nearby Homes
- 2265 Hampton Dr
- 2268 Hampton Dr
- 2292 Hampton Dr
- 2388 Cedarmill Dr
- 2509 Cedarmill Dr
- 2159 Somerset Dr
- 2425 Bristol Dr
- 2230 Cedarmill Dr
- 2135 Somerset Dr
- 2485 Bristol Dr
- 2707 Muirfield St
- 2458 Bristol Dr
- 1174 Blackstone Ave
- 2719 Muirfield St
- 2743 Muirfield St
- 2755 Muirfield St
- 2258 Bridlewood Dr
- 1118 Fairmount Dr
- 1105 Winterfield Blvd
- 1099 Winterfield Blvd
- 2394 Somerset Cir
- 2390 Somerset Cir
- 2396 Somerset Cir
- 2386 Somerset Cir
- 2393 Somerset Cir
- 2400 Somerset Cir
- 2374 Somerset Cir
- 2373 Somerset Cir
- 2415 Somerset Cir
- 2368 Somerset Cir
- 2367 Somerset Dr
- 2367 Somerset Cir
- 2410 Somerset Cir
- 2445 Somerset Cir
- 2356 Somerset Cir
- 2353 Somerset Cir
- 2353 Somerset Cir
- 2455 Somerset Cir
- 2418 Somerset Cir
- 2341 Somerset Cir