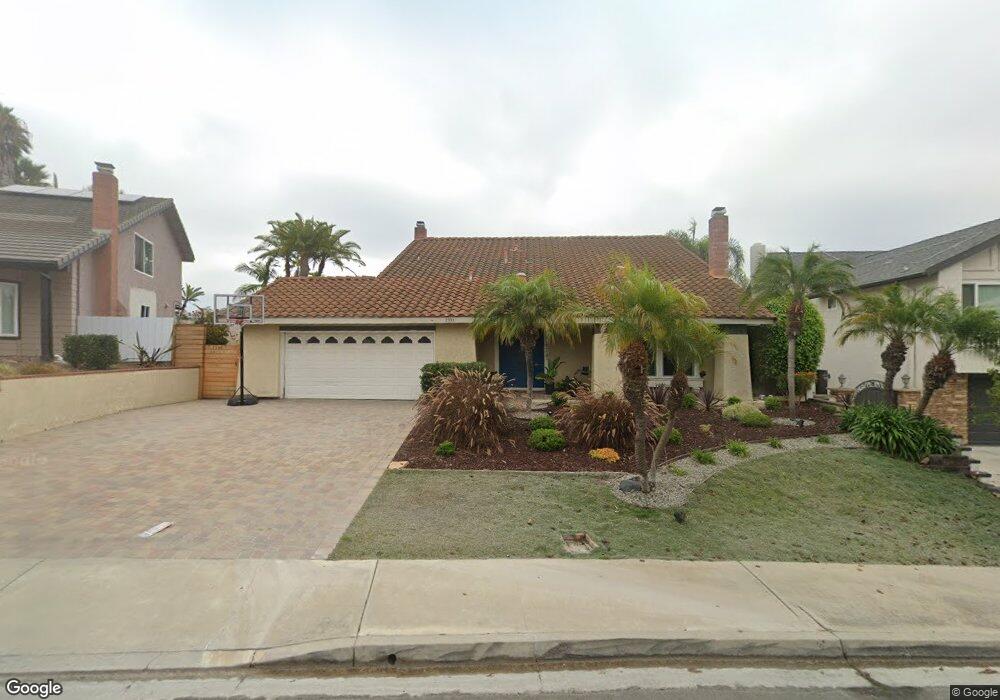
2393 Carriage Cir Oceanside, CA 92056
Mira Costa NeighborhoodEstimated Value: $719,000 - $1,351,000
1
Bed
4
Baths
728
Sq Ft
$1,569/Sq Ft
Est. Value
About This Home
This home is located at 2393 Carriage Cir, Oceanside, CA 92056 and is currently estimated at $1,142,230, approximately $1,568 per square foot. 2393 Carriage Cir is a home located in San Diego County with nearby schools including Palmquist Elementary School, Martin Luther King Jr. Middle School, and El Camino High School.
Ownership History
Date
Name
Owned For
Owner Type
Purchase Details
Closed on
Nov 19, 2014
Sold by
Cannon Pete E and Cannon Martha L
Bought by
Cannon Family Trust
Current Estimated Value
Purchase Details
Closed on
Jul 11, 2013
Sold by
Mibeck Genevieve A
Bought by
Cannon Pete E and Cannon Martha L
Home Financials for this Owner
Home Financials are based on the most recent Mortgage that was taken out on this home.
Original Mortgage
$360,000
Outstanding Balance
$302,840
Interest Rate
4%
Mortgage Type
Adjustable Rate Mortgage/ARM
Estimated Equity
$839,390
Purchase Details
Closed on
Nov 28, 2001
Sold by
Mibeck Genevieve A
Bought by
Mibeck Genevieve A
Purchase Details
Closed on
Oct 6, 1998
Sold by
Mibeck Family Trust 09-22-89
Bought by
Mibeck Genevieve A
Purchase Details
Closed on
May 14, 1996
Sold by
Va
Bought by
Mibeck Albert E and Mibeck Genevieve A
Purchase Details
Closed on
Apr 20, 1988
Create a Home Valuation Report for This Property
The Home Valuation Report is an in-depth analysis detailing your home's value as well as a comparison with similar homes in the area
Home Values in the Area
Average Home Value in this Area
Purchase History
| Date | Buyer | Sale Price | Title Company |
|---|---|---|---|
| Cannon Family Trust | -- | None Available | |
| Cannon Pete E | $450,000 | Ticor Title Company Of Calif | |
| Mibeck Genevieve A | -- | -- | |
| Mibeck Genevieve A | -- | -- | |
| Mibeck Genevieve A | -- | -- | |
| Mibeck Albert E | -- | -- | |
| -- | $179,000 | -- |
Source: Public Records
Mortgage History
| Date | Status | Borrower | Loan Amount |
|---|---|---|---|
| Open | Cannon Pete E | $360,000 |
Source: Public Records
Tax History
| Year | Tax Paid | Tax Assessment Tax Assessment Total Assessment is a certain percentage of the fair market value that is determined by local assessors to be the total taxable value of land and additions on the property. | Land | Improvement |
|---|---|---|---|---|
| 2025 | $7,950 | $706,668 | $63,891 | $642,777 |
| 2024 | $7,798 | $692,813 | $62,639 | $630,174 |
| 2023 | $5,910 | $530,210 | $61,411 | $468,799 |
| 2022 | $5,821 | $519,814 | $60,207 | $459,607 |
| 2021 | $5,844 | $509,623 | $59,027 | $450,596 |
| 2020 | $5,664 | $504,398 | $58,422 | $445,976 |
| 2019 | $5,500 | $494,509 | $57,277 | $437,232 |
| 2018 | $5,441 | $484,813 | $56,154 | $428,659 |
| 2017 | $5,342 | $475,307 | $55,053 | $420,254 |
| 2016 | $5,169 | $465,988 | $53,974 | $412,014 |
| 2015 | $5,018 | $458,990 | $53,164 | $405,826 |
| 2014 | $4,824 | $450,000 | $52,123 | $397,877 |
Source: Public Records
Map
Nearby Homes
- 0 Oceanview Rd Unit NDP2504901
- 2210 Valley Rd
- 3349 Par Dr
- 3315 Tripoli Way
- 3328 Malta Way
- 2360 Paseo de Laura Unit 2
- 2360 Paseo de Laura Unit 1
- 2335 Cartegena Way
- 3315 Genoa Way Unit 96
- 3325 Genoa Way Unit 110
- 3376 Corsica Way
- 3365 Genoa Way Unit 135
- 3335 Genoa Way Unit 112
- 3529 Santa Maria St
- 2077 Tiffany Dr
- 3531 Cameo Dr Unit 98
- 3225 Avenida de Loyola
- 2128 Via Sonora
- 3459 Paseo de Alicia Unit 20
- 3553 Paseo de Francisco Unit 209
- 2393 Carriage Cir Unit 2
- 2393 Carriage Cir
- 2391 Carriage Cir
- 2395 Carriage Cir
- 2389 Carriage Cir
- 2397 Carriage Cir
- 3193 El Lando Ct
- 3187 El Lando Ct
- 2399 Carriage Cir
- 2387 Carriage Cir
- 3183 El Lando Ct
- 2401 Carriage Cir
- 2385 Carriage Cir
- 3179 El Lando Ct
- 2405 Carriage Cir
- 3191 Brougham Ct
- 2383 Carriage Cir
- 3185 Brougham Ct
- 3181 Brougham Ct
- 2381 Carriage Cir
Your Personal Tour Guide
Ask me questions while you tour the home.