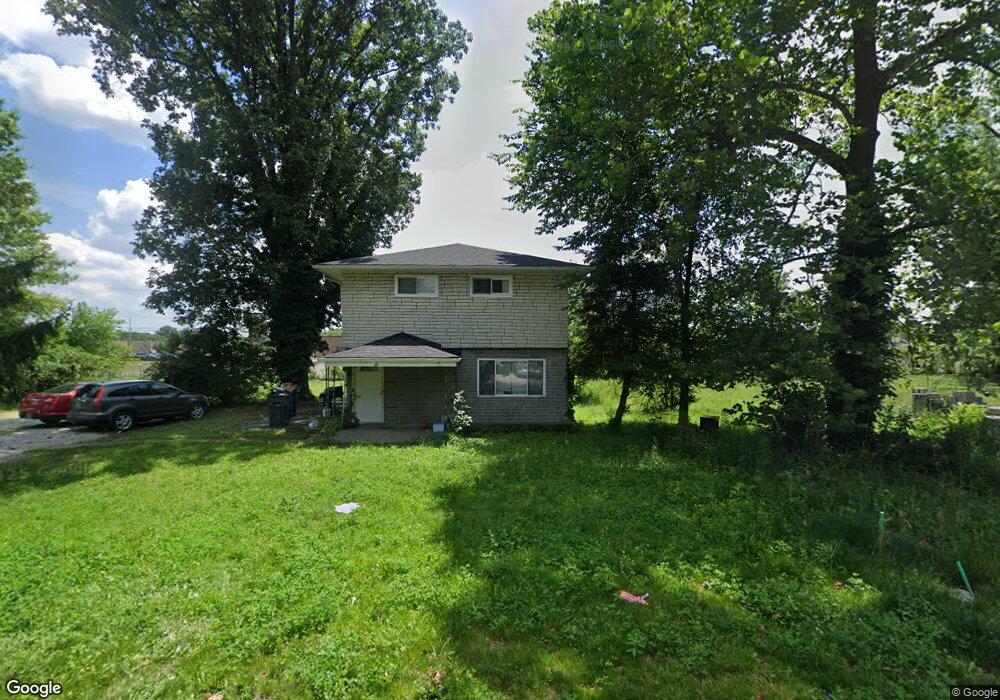
2395 Brooklyn Rd Columbus, OH 43231
Forest Park East NeighborhoodEstimated Value: $153,000 - $218,768
3
Beds
2
Baths
1,632
Sq Ft
$122/Sq Ft
Est. Value
About This Home
This home is located at 2395 Brooklyn Rd, Columbus, OH 43231 and is currently estimated at $199,692, approximately $122 per square foot. 2395 Brooklyn Rd is a home located in Franklin County with nearby schools including Pointview Elementary School, Genoa Middle School, and Westerville-North High School.
Ownership History
Date
Name
Owned For
Owner Type
Purchase Details
Closed on
Apr 5, 2022
Sold by
Harmony Management Services Llc
Bought by
Guled Rukiya M and Gure Asha
Current Estimated Value
Purchase Details
Closed on
Mar 28, 2022
Sold by
Harmony Management Services Llc
Bought by
Guled Rukiya M and Gure Asha
Purchase Details
Closed on
Mar 17, 2011
Sold by
Hussein Abdulkadir and Ahmed Isak A
Bought by
Harmony Management Services Llc
Home Financials for this Owner
Home Financials are based on the most recent Mortgage that was taken out on this home.
Original Mortgage
$36,000
Interest Rate
5.04%
Mortgage Type
Seller Take Back
Purchase Details
Closed on
Nov 13, 2009
Sold by
Barr Paul R and Paul F Barr Revocable Trust
Bought by
Hussein Abdulkadir and Ahmed Isak A
Purchase Details
Closed on
Jan 24, 2002
Sold by
Barr Paul F
Bought by
Barr Paul F and The Paul F Barr Revocable Trus
Purchase Details
Closed on
Jun 30, 1993
Bought by
Barr Paul F and Jo Ann
Create a Home Valuation Report for This Property
The Home Valuation Report is an in-depth analysis detailing your home's value as well as a comparison with similar homes in the area
Home Values in the Area
Average Home Value in this Area
Purchase History
| Date | Buyer | Sale Price | Title Company |
|---|---|---|---|
| Guled Rukiya M | $130,000 | Hampton Title | |
| Guled Rukiya M | $130,000 | Hampton Title | |
| Harmony Management Services Llc | $80,000 | Talon Group | |
| Hussein Abdulkadir | $65,000 | Talon Group | |
| Barr Paul F | -- | -- | |
| Barr Paul F | -- | -- |
Source: Public Records
Mortgage History
| Date | Status | Borrower | Loan Amount |
|---|---|---|---|
| Previous Owner | Harmony Management Services Llc | $36,000 |
Source: Public Records
Tax History Compared to Growth
Tax History
| Year | Tax Paid | Tax Assessment Tax Assessment Total Assessment is a certain percentage of the fair market value that is determined by local assessors to be the total taxable value of land and additions on the property. | Land | Improvement |
|---|---|---|---|---|
| 2024 | $4,067 | $54,850 | $9,770 | $45,080 |
| 2023 | $2,667 | $54,850 | $9,770 | $45,080 |
| 2022 | $2,463 | $37,730 | $7,070 | $30,660 |
| 2021 | $2,487 | $37,730 | $7,070 | $30,660 |
| 2020 | $2,479 | $37,730 | $7,070 | $30,660 |
| 2019 | $2,132 | $30,880 | $5,920 | $24,960 |
| 2018 | $1,043 | $30,880 | $5,920 | $24,960 |
| 2017 | $2,092 | $30,880 | $5,920 | $24,960 |
| 2016 | $1,599 | $21,530 | $1,440 | $20,090 |
| 2015 | $801 | $21,530 | $1,440 | $20,090 |
| 2014 | $1,604 | $21,530 | $1,440 | $20,090 |
| 2013 | $840 | $22,645 | $1,505 | $21,140 |
Source: Public Records
Map
Nearby Homes
- 2594 Adda Ave
- 2625 Clybourne Rd
- 2244 Balmoral Rd
- 0 Abington Rd Unit 224031739
- 0 Abington Rd Unit 224031704
- 0 Abington Rd Unit 224031738
- 0 Abington Rd Unit 224031699
- 0 Ashbury Rd
- 0 Chester Rd
- 0 Claridon Rd
- 2576 Claridon Rd
- 2144 Colfax Ave
- 2208 Fenton St
- 4309 Walford St
- 2096 Colfax Ave
- 4714 Ascot Dr
- 2691 Northwold Rd
- 2134 Trent Rd
- 2194 Ashley Dr
- 4849 Heatherton Dr
- 2385 Brooklyn Rd
- 2391 Brooklyn Rd
- 2375 Brooklyn Rd
- 2388 Brooklyn Rd
- 2404 Brooklyn Rd
- 2382 Brooklyn Rd
- 2366 Brooklyn Rd
- 2425 Brooklyn Rd
- 2408 Brooklyn Rd
- 2445 Brooklyn Rd
- 0 Brooklyn Rd
- 2351 Brooklyn Rd
- 2351 Brooklyn Rd
- 2351 Brooklyn Rd
- 2351 Brooklyn Rd
- 2351 Brooklyn Rd
- 2351 Brooklyn Rd
- 2351 Brooklyn Rd
- 2424 Brooklyn Rd
- 0 Brooklyn Rd