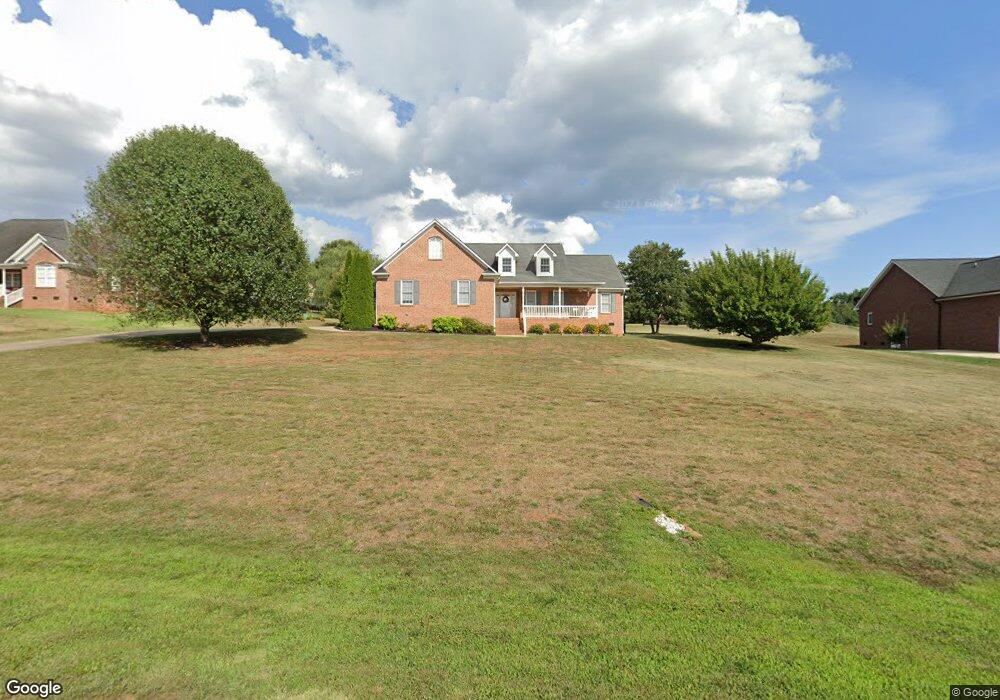
2395 Carriage Ln Lincolnton, NC 28092
Estimated Value: $391,000 - $541,000
3
Beds
2
Baths
2,297
Sq Ft
$208/Sq Ft
Est. Value
About This Home
This home is located at 2395 Carriage Ln, Lincolnton, NC 28092 and is currently estimated at $477,604, approximately $207 per square foot. 2395 Carriage Ln is a home located in Lincoln County with nearby schools including Norris S. Childers Elementary School, Lincolnton Middle School, and Lincolnton High School.
Ownership History
Date
Name
Owned For
Owner Type
Purchase Details
Closed on
Aug 9, 2010
Sold by
Federal National Mortgage Association
Bought by
Pollok David and Pollok Jackie
Current Estimated Value
Purchase Details
Closed on
Mar 9, 2010
Sold by
Pope James P and Pope Crystal
Bought by
Federal National Mortgage Association
Purchase Details
Closed on
Jan 12, 2010
Sold by
Pope Crystal D
Bought by
Pope James P
Purchase Details
Closed on
Sep 28, 2005
Sold by
Clark Larry and Clark Joy
Bought by
Pope James P and Pope Crystal
Home Financials for this Owner
Home Financials are based on the most recent Mortgage that was taken out on this home.
Original Mortgage
$191,920
Interest Rate
6.84%
Mortgage Type
Assumption
Purchase Details
Closed on
Aug 22, 2001
Bought by
Larry Clark Builders
Purchase Details
Closed on
Aug 18, 1999
Bought by
Lail Guy W and Lail Billie G
Purchase Details
Closed on
Aug 14, 1998
Bought by
Patterson Gary D and Patterson Jill R
Create a Home Valuation Report for This Property
The Home Valuation Report is an in-depth analysis detailing your home's value as well as a comparison with similar homes in the area
Home Values in the Area
Average Home Value in this Area
Purchase History
| Date | Buyer | Sale Price | Title Company |
|---|---|---|---|
| Pollok David | -- | None Available | |
| Federal National Mortgage Association | $219,045 | None Available | |
| Pope James P | -- | None Available | |
| Pope James P | -- | None Available | |
| Larry Clark Builders | $43,000 | -- | |
| Lail Guy W | $12,000 | -- | |
| Patterson Gary D | $13,500 | -- |
Source: Public Records
Mortgage History
| Date | Status | Borrower | Loan Amount |
|---|---|---|---|
| Previous Owner | Pope James P | $191,920 |
Source: Public Records
Tax History Compared to Growth
Tax History
| Year | Tax Paid | Tax Assessment Tax Assessment Total Assessment is a certain percentage of the fair market value that is determined by local assessors to be the total taxable value of land and additions on the property. | Land | Improvement |
|---|---|---|---|---|
| 2025 | $2,980 | $470,165 | $33,000 | $437,165 |
| 2024 | $2,960 | $470,165 | $33,000 | $437,165 |
| 2023 | $2,884 | $470,165 | $33,000 | $437,165 |
| 2022 | $2,132 | $284,486 | $27,000 | $257,486 |
| 2021 | $2,075 | $284,486 | $27,000 | $257,486 |
| 2020 | $1,903 | $284,486 | $27,000 | $257,486 |
| 2019 | $1,903 | $284,486 | $27,000 | $257,486 |
| 2018 | $1,835 | $254,587 | $27,500 | $227,087 |
| 2017 | $1,657 | $254,587 | $27,500 | $227,087 |
| 2016 | $1,657 | $254,587 | $27,500 | $227,087 |
| 2015 | $1,710 | $254,587 | $27,500 | $227,087 |
| 2014 | $1,612 | $241,675 | $27,500 | $214,175 |
Source: Public Records
Map
Nearby Homes
- 2400 Carriage Ln
- 2616 Carriage Ln
- 3200 River Rd
- 3603 Ritchie Rd
- 2705 Eagle Dr
- 2748 Eagle Dr
- 2845 Wood Gate Rd
- 0 Eva Ct
- 00 Park Cir
- Pearson Plan at Clark Creek Landing - Townhomes
- Newton Plan at Clark Creek Landing - Townhomes
- Maywood Plan at Clark Creek Landing - Townhomes
- Elston Plan at Clark Creek Landing
- Hamilton Plan at Clark Creek Landing
- Darwin Plan at Clark Creek Landing
- Aisle Plan at Clark Creek Landing
- Taylor Plan at Clark Creek Landing
- Hayden Plan at Clark Creek Landing
- Cali Plan at Clark Creek Landing
- Belhaven Plan at Clark Creek Landing
- 2411 Carriage Ln
- 2379 Carriage Ln
- 2363 Carriage Ln
- 2701 Carriage Ln
- 2685 Carriage Ln
- 2390 Carriage Ln
- 2380 Carriage Ln
- 2380 Carriage Ln Unit 15
- 2713 Carriage Ln
- 15 Carriage Ln
- 15 Carriage Ln Unit 15
- Lot #55 Carriage Ln
- 2414 Carriage Ln
- 000 Carriage Ln
- 2673 Carriage Ln
- 0 Carriage Ln Unit 834744
- 0 Carriage Ln Unit 3305867
- 0 Carriage Ln Unit 19 3351158
- 0 Carriage Ln Unit 18 3351146
- Lot #9 Carriage Ln