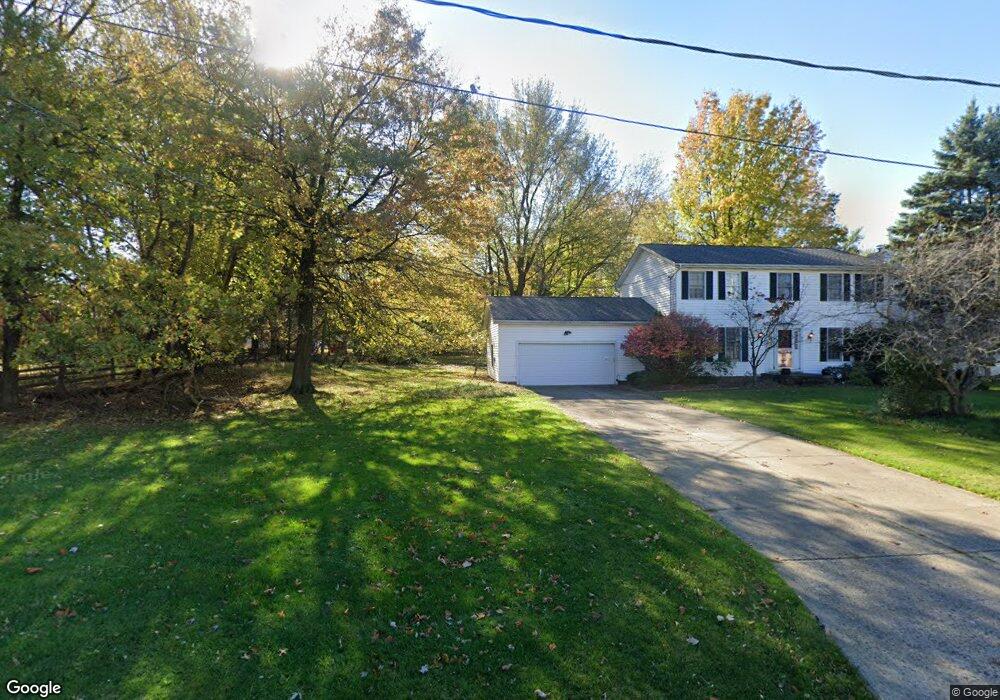
23950 Euclid Chagrin Pkwy Cleveland, OH 44143
Estimated Value: $280,000 - $295,000
4
Beds
3
Baths
2,009
Sq Ft
$144/Sq Ft
Est. Value
About This Home
This home is located at 23950 Euclid Chagrin Pkwy, Cleveland, OH 44143 and is currently estimated at $290,223, approximately $144 per square foot. 23950 Euclid Chagrin Pkwy is a home located in Cuyahoga County with nearby schools including Richmond Heights Elementary School, Richmond Heights Secondary School, and Noble Academy-Cleveland.
Ownership History
Date
Name
Owned For
Owner Type
Purchase Details
Closed on
May 23, 2003
Sold by
Cregan John P and Cregan Jean M
Bought by
Philpot Gayle L
Current Estimated Value
Home Financials for this Owner
Home Financials are based on the most recent Mortgage that was taken out on this home.
Original Mortgage
$199,900
Outstanding Balance
$87,576
Interest Rate
5.9%
Mortgage Type
Purchase Money Mortgage
Estimated Equity
$202,647
Purchase Details
Closed on
Feb 12, 1993
Sold by
Smoltz Robert J
Bought by
Cregan John P
Purchase Details
Closed on
Aug 31, 1984
Sold by
Hovancsek Anne Marie
Bought by
Smoltz Robert J
Purchase Details
Closed on
Nov 30, 1976
Sold by
Edwards Mason D and Edwards Roberta J
Bought by
Hovancsek Anne Marie
Purchase Details
Closed on
Jan 1, 1975
Bought by
Edwards Mason D and Edwards Roberta J
Create a Home Valuation Report for This Property
The Home Valuation Report is an in-depth analysis detailing your home's value as well as a comparison with similar homes in the area
Home Values in the Area
Average Home Value in this Area
Purchase History
| Date | Buyer | Sale Price | Title Company |
|---|---|---|---|
| Philpot Gayle L | $199,900 | Northstar Title Services Llc | |
| Cregan John P | $153,000 | -- | |
| Smoltz Robert J | $20,000 | -- | |
| Hovancsek Anne Marie | $9,500 | -- | |
| Edwards Mason D | -- | -- |
Source: Public Records
Mortgage History
| Date | Status | Borrower | Loan Amount |
|---|---|---|---|
| Open | Philpot Gayle L | $199,900 |
Source: Public Records
Tax History Compared to Growth
Tax History
| Year | Tax Paid | Tax Assessment Tax Assessment Total Assessment is a certain percentage of the fair market value that is determined by local assessors to be the total taxable value of land and additions on the property. | Land | Improvement |
|---|---|---|---|---|
| 2024 | $6,778 | $90,125 | $13,335 | $76,790 |
| 2023 | $5,515 | $59,300 | $10,610 | $48,690 |
| 2022 | $5,473 | $59,290 | $10,610 | $48,690 |
| 2021 | $5,448 | $59,290 | $10,610 | $48,690 |
| 2020 | $5,134 | $51,100 | $9,140 | $41,970 |
| 2019 | $5,059 | $146,000 | $26,100 | $119,900 |
| 2018 | $5,416 | $51,100 | $9,140 | $41,970 |
| 2017 | $6,664 | $66,080 | $8,540 | $57,540 |
| 2016 | $5,820 | $66,080 | $8,540 | $57,540 |
| 2015 | $5,678 | $66,080 | $8,540 | $57,540 |
| 2014 | $5,678 | $64,790 | $8,370 | $56,420 |
Source: Public Records
Map
Nearby Homes
- 24720 Dundee Dr
- 321 Royal Oak Blvd
- 467 Harris Rd
- 22601 Harms Rd
- 341 Knollwood Trail
- 24801 Highland Rd
- 470 Celestia Dr
- 1765 E 238th St
- 2075 E 226th St
- 2093 Newcome St
- 1997 E 226th St
- 2084 E 224th St
- 22151 Hadden Rd
- 502 Jeannette Dr
- 2545 Hilltop Rd
- 2010 E 221st St
- 4473 Habersham Ln S Unit 187
- 4450 Habersham Ln S Unit 201
- 237 Greenbriar Ct Unit F237
- 593 Dade Ln
- 394 Douglas Blvd
- 23940 Euclid Chagrin Pkwy
- 392 Douglas Blvd
- 23951 Euclid Chagrin Pkwy
- 393 Harris Rd
- 23941 Euclid Chagrin Pkwy
- 23971 Euclid Chagrin Pkwy
- 391 Harris Rd
- 23931 Euclid Chagrin Pkwy
- 23981 Euclid Chagrin Pkwy
- 400 Douglas Blvd
- 23921 Harms Rd
- 397 Harris Rd
- 23991 Euclid Chagrin Pkwy
- 391 Douglas Blvd
- 382 Balmoral Dr
- 393 Douglas Blvd
- 393 Douglas Blvd
- 23911 Euclid Chagrin Pkwy
- 399 Harris Rd