23953 Dorrington Estates Ln Conroe, TX 77385
Imperial Oaks NeighborhoodEstimated Value: $343,923 - $369,000
4
Beds
2
Baths
2,359
Sq Ft
$150/Sq Ft
Est. Value
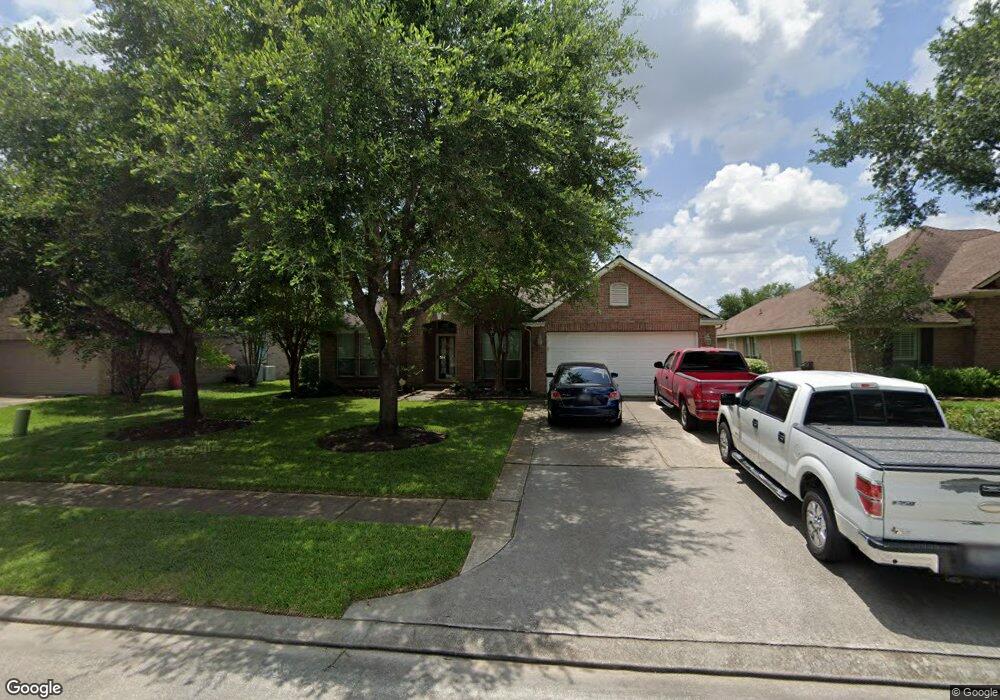
About This Home
This home is located at 23953 Dorrington Estates Ln, Conroe, TX 77385 and is currently estimated at $354,731, approximately $150 per square foot. 23953 Dorrington Estates Ln is a home located in Montgomery County with nearby schools including Kaufman Elementary School, Vogel Intermediate School, and Irons J High School.
Ownership History
Date
Name
Owned For
Owner Type
Purchase Details
Closed on
Dec 29, 2011
Sold by
Alaniz Sarah H and Alaniz Jose C
Bought by
Smith Charlena R
Current Estimated Value
Home Financials for this Owner
Home Financials are based on the most recent Mortgage that was taken out on this home.
Original Mortgage
$124,800
Outstanding Balance
$85,723
Interest Rate
4.02%
Mortgage Type
New Conventional
Estimated Equity
$269,008
Purchase Details
Closed on
May 14, 2001
Sold by
Kb Home Lone Star Lp
Bought by
Alaniz Sarah H and Alaniz Jose C
Home Financials for this Owner
Home Financials are based on the most recent Mortgage that was taken out on this home.
Original Mortgage
$145,724
Interest Rate
7.11%
Purchase Details
Closed on
Mar 20, 2000
Sold by
Imperial Oaks Joint Venture
Bought by
Smith Charlena R
Create a Home Valuation Report for This Property
The Home Valuation Report is an in-depth analysis detailing your home's value as well as a comparison with similar homes in the area
Home Values in the Area
Average Home Value in this Area
Purchase History
| Date | Buyer | Sale Price | Title Company |
|---|---|---|---|
| Smith Charlena R | -- | Stewart Title | |
| Alaniz Sarah H | -- | San Antonio Title Co | |
| Smith Charlena R | -- | -- |
Source: Public Records
Mortgage History
| Date | Status | Borrower | Loan Amount |
|---|---|---|---|
| Open | Smith Charlena R | $124,800 | |
| Previous Owner | Alaniz Sarah H | $145,724 |
Source: Public Records
Tax History Compared to Growth
Tax History
| Year | Tax Paid | Tax Assessment Tax Assessment Total Assessment is a certain percentage of the fair market value that is determined by local assessors to be the total taxable value of land and additions on the property. | Land | Improvement |
|---|---|---|---|---|
| 2025 | $5,519 | $348,238 | $68,000 | $280,238 |
| 2024 | $4,914 | $333,619 | -- | -- |
| 2023 | $4,914 | $303,290 | $68,000 | $277,430 |
| 2022 | $6,358 | $275,720 | $29,580 | $277,430 |
| 2021 | $6,223 | $250,650 | $29,580 | $221,070 |
| 2020 | $6,187 | $239,410 | $29,580 | $209,830 |
| 2019 | $5,923 | $234,640 | $29,580 | $205,060 |
| 2018 | $5,170 | $222,490 | $29,580 | $192,910 |
| 2017 | $6,146 | $226,670 | $29,580 | $197,090 |
| 2016 | $6,146 | $226,670 | $29,580 | $197,090 |
| 2015 | $4,995 | $208,380 | $29,580 | $184,680 |
| 2014 | $4,995 | $189,440 | $29,580 | $159,860 |
Source: Public Records
Map
Nearby Homes
- 22941 Antiqua Estates Ct
- 1427 Redwood Village Cir
- 2103 Winding Hollow Ct
- 2143 Westover Park Cir
- 1423 W Welsford Dr
- 2047 Copperwood Park Ln
- 1627 Sterling Village Dr
- 32319 Archer Park
- 31002 Deerwood Park Ln
- 32331 Summer Park Ln
- 2526 Hidden Park Ln
- 31115 Perlican Dr
- 11291 Darby Loop
- 31311 N Head Dr
- 31235 Windcrest Park Ln
- 32315 Golden Oak Park Ln
- 2614 Winding Creek Way
- 2611 Winding Creek Way
- 31214 Windcrest Park Ln
- 1514 Buchans Dr
- 23957 Dorrington Estates Ln
- 23949 Dorrington Estates Ln
- 23945 Dorrington Estates Ln
- 23961 Dorrington Estates Ln
- 23958 Dorrington Estates Ln
- 23954 Dorrington Estates Ln
- 23941 Dorrington Estates Ln
- 23962 Dorrington Estates Ln
- 23950 Dorrington Estates Ln
- 23965 Dorrington Estates Ln
- 23946 Dorrington Estates Ln
- 23966 Dorrington Estates Ln
- 23937 Dorrington Estates Ln
- 22989 Ridgemoor Estates Ct
- 10997 Mercer Estates Ct
- 22981 Woodside Estates Ln
- 22994 Ridgemoor Estates Ct
- 23970 Dorrington Estates Ln
- 10995 Mercer Estates Ct
- 23933 Dorrington Estates Ln