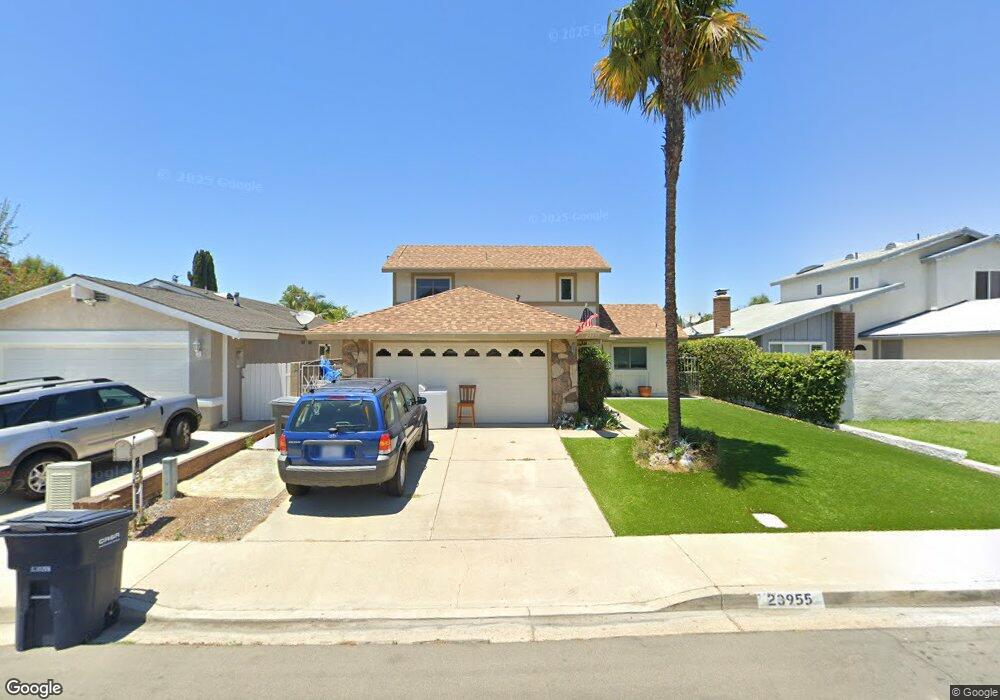
23955 Raleigh St Lake Forest, CA 92630
Estimated Value: $1,047,927 - $1,154,000
4
Beds
2
Baths
1,540
Sq Ft
$718/Sq Ft
Est. Value
About This Home
This home is located at 23955 Raleigh St, Lake Forest, CA 92630 and is currently estimated at $1,105,982, approximately $718 per square foot. 23955 Raleigh St is a home located in Orange County with nearby schools including Olivewood Elementary School, Serrano Intermediate School, and El Toro High School.
Ownership History
Date
Name
Owned For
Owner Type
Purchase Details
Closed on
Nov 23, 2021
Sold by
Yost Janice
Bought by
Yost Janice and The Janice Yost Family Trust
Current Estimated Value
Home Financials for this Owner
Home Financials are based on the most recent Mortgage that was taken out on this home.
Original Mortgage
$250,000
Outstanding Balance
$229,398
Interest Rate
3.09%
Mortgage Type
New Conventional
Estimated Equity
$876,584
Purchase Details
Closed on
May 30, 2012
Sold by
Yost Janice
Bought by
Yost Janice and Janice Yost Family Trust
Purchase Details
Closed on
Mar 3, 2010
Sold by
Kirner Randall J
Bought by
Yost Janice
Home Financials for this Owner
Home Financials are based on the most recent Mortgage that was taken out on this home.
Original Mortgage
$175,000
Interest Rate
4.93%
Mortgage Type
New Conventional
Purchase Details
Closed on
May 16, 1994
Sold by
Albertson Arnold and Albertson Lorine
Bought by
Albertson Lorine M
Create a Home Valuation Report for This Property
The Home Valuation Report is an in-depth analysis detailing your home's value as well as a comparison with similar homes in the area
Home Values in the Area
Average Home Value in this Area
Purchase History
| Date | Buyer | Sale Price | Title Company |
|---|---|---|---|
| Yost Janice | -- | First American Title Ins Co | |
| Yost Janice | -- | First American Title Ins Co | |
| Yost Janice | -- | None Available | |
| Yost Janice | -- | Lsi Title Company | |
| Albertson Lorine M | -- | -- |
Source: Public Records
Mortgage History
| Date | Status | Borrower | Loan Amount |
|---|---|---|---|
| Open | Yost Janice | $250,000 | |
| Closed | Yost Janice | $175,000 |
Source: Public Records
Tax History Compared to Growth
Tax History
| Year | Tax Paid | Tax Assessment Tax Assessment Total Assessment is a certain percentage of the fair market value that is determined by local assessors to be the total taxable value of land and additions on the property. | Land | Improvement |
|---|---|---|---|---|
| 2025 | $2,375 | $237,724 | $110,952 | $126,772 |
| 2024 | $2,375 | $233,063 | $108,776 | $124,287 |
| 2023 | $2,318 | $228,494 | $106,644 | $121,850 |
| 2022 | $2,276 | $224,014 | $104,553 | $119,461 |
| 2021 | $2,229 | $219,622 | $102,503 | $117,119 |
| 2020 | $2,208 | $217,371 | $101,452 | $115,919 |
| 2019 | $2,163 | $213,109 | $99,462 | $113,647 |
| 2018 | $2,121 | $208,931 | $97,512 | $111,419 |
| 2017 | $2,078 | $204,835 | $95,600 | $109,235 |
| 2016 | $2,042 | $200,819 | $93,725 | $107,094 |
| 2015 | $2,016 | $197,803 | $92,317 | $105,486 |
| 2014 | $1,971 | $193,929 | $90,509 | $103,420 |
Source: Public Records
Map
Nearby Homes
- 23981 Crescent Rd
- 22682 S Canada Ct
- 22627 Lakeside Ln
- 22661 Pine Lake Ln
- 23976 Carmel Dr
- 23211 Meadowbrook Cir
- 22576 Lake Forest Ln
- 22482 Lake Forest Ln
- 22875 Ridge Route Ln
- 24001 Muirlands Blvd Unit 411
- 24001 Muirlands Blvd Unit 56
- 24001 Muirlands Blvd Unit 221
- 24001 Muirlands Blvd Unit 185
- 24001 Muirlands Blvd Unit 329
- 24001 Muirlands Blvd Unit 347
- 24001 Muirlands Blvd Unit 115
- 24001 Muirlands Blvd Unit 34
- 24001 Muirlands Blvd Unit 119
- 24001 Muirlands Blvd Unit 268
- 24001 Muirlands Blvd Unit 147
- 23961 Raleigh St
- 23951 Raleigh St
- 23971 Raleigh St
- 23945 Raleigh St
- 23926 Oswego St
- 23922 Oswego St
- 23932 Oswego St
- 23916 Oswego St
- 23942 Oswego St
- 22911 Sierra St
- 23975 Raleigh St
- 23941 Raleigh St
- 23946 Oswego St
- 22912 Sierra St
- 23912 Oswego St
- 22921 Sierra St
- 23981 Raleigh St
- 22952 Aspan St
- 23952 Oswego St
- 22922 Sierra St